


Part of The Underwriter’s Read, a series on the critical questions a credit team works through before they lend.
Coverage is the ratio of the cash a business generates to the debt service it owes. It is the first figure a lender looks at, and the one the loan is repaid from. A borrower that reports $10mm of adjusted EBITDA and $4mm of annual debt service shows coverage of 2.5 times. A lender rebuilds both halves of that ratio before accepting it: the EBITDA, by testing each add-back and converting it to cash, and the debt service, by using the definitions in the credit agreement.
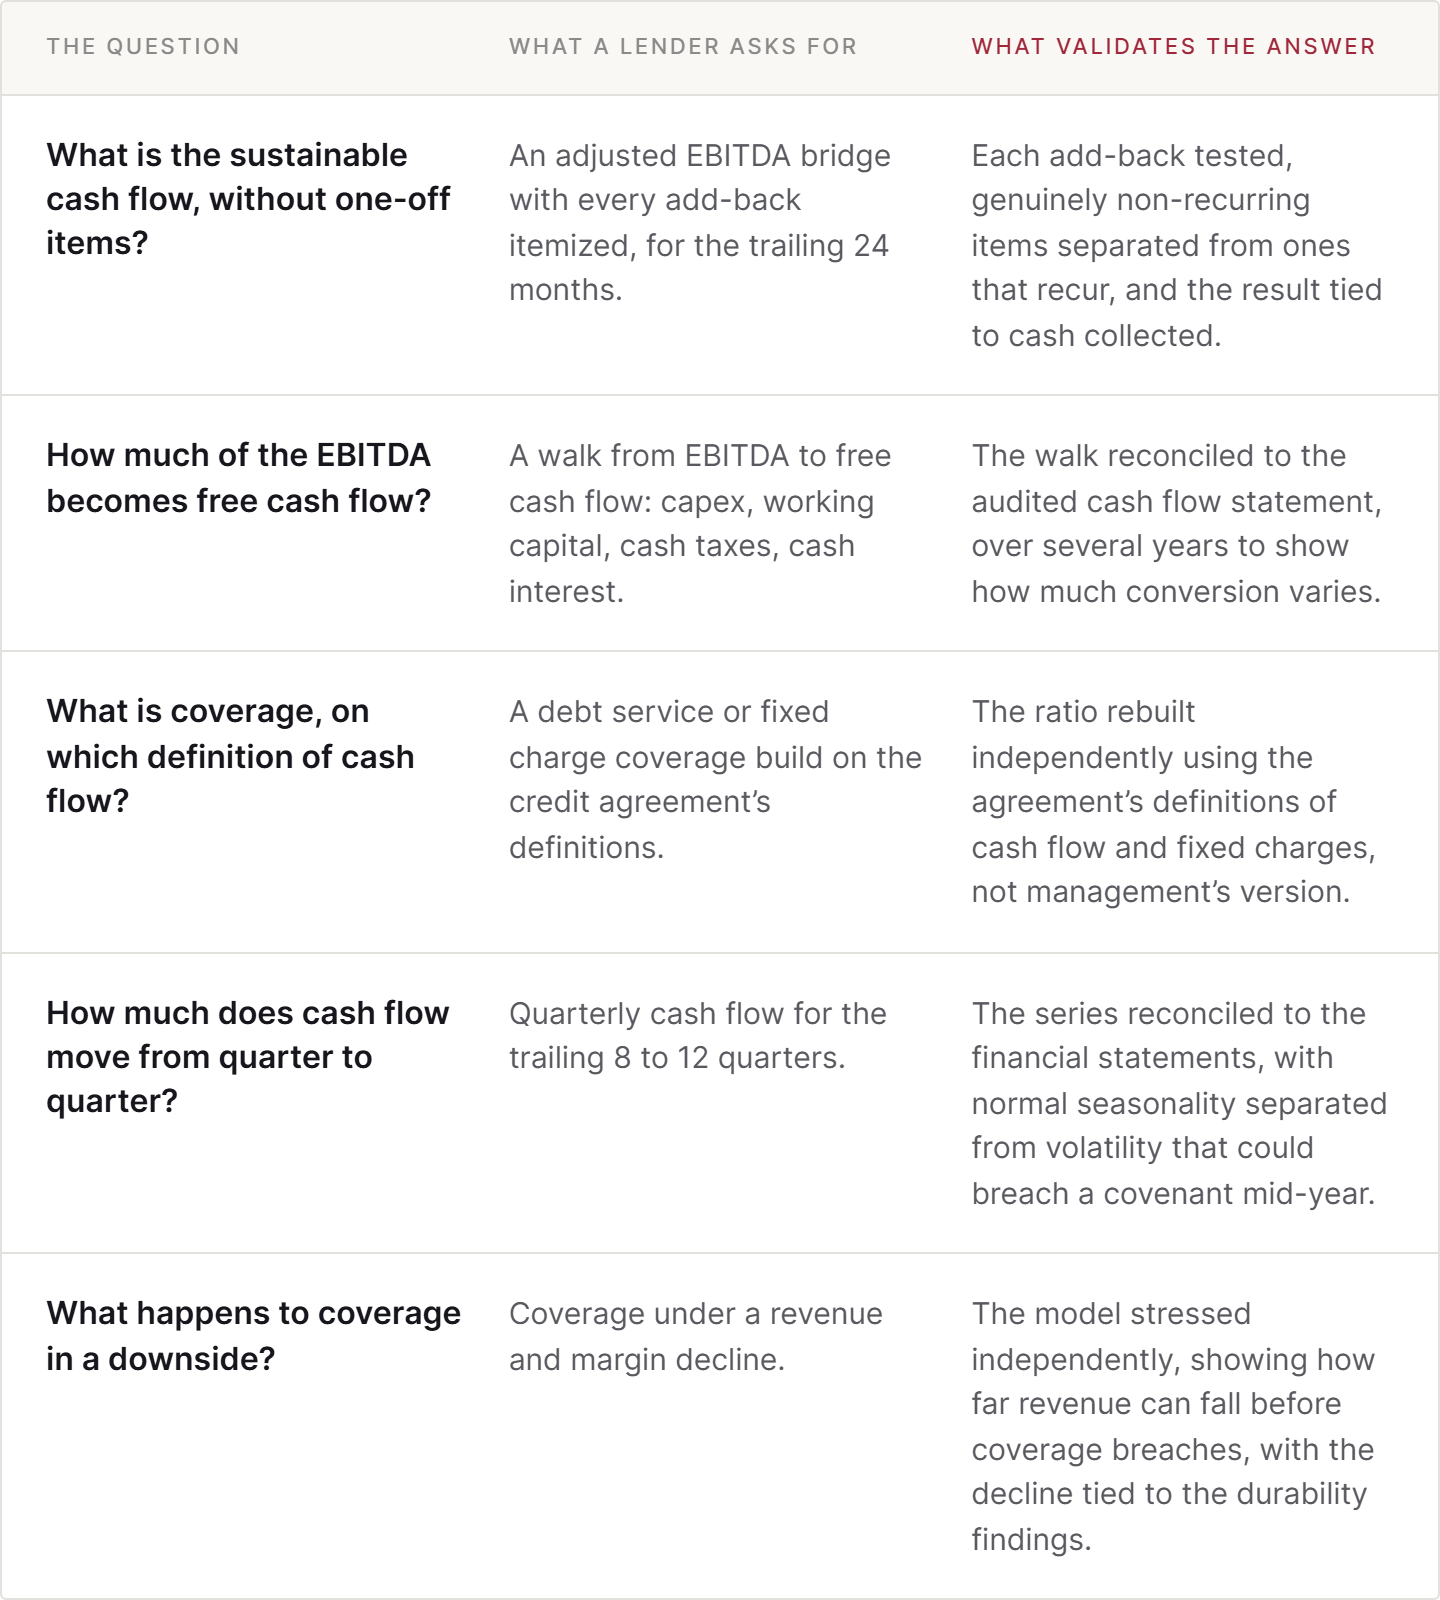
Five probes sit in this component. The first strips one-off items out of EBITDA. The second converts what is left into free cash flow. The third calculates coverage on the credit agreement’s definitions. The fourth looks at how much cash flow moves from quarter to quarter. The fifth tests coverage in a downside. Each one takes the reported figure a step closer to the cash that will actually be available to pay the lender.
This component is where a lender’s own projection starts. Management’s forecast begins from its adjusted EBITDA and grows it. A lender begins from the EBITDA left after its own add-back review, converts it to free cash flow using the borrower’s historical conversion rate, and applies the growth assumptions supported by the model layer. The coverage in the lender’s base case is often lower than management’s, and the gap comes from specific add-backs and conversion items that a borrower can see and discuss.
The five probes, and what validates the answer
Testing the add-backs
Adjusted EBITDA is reported EBITDA plus a list of costs management considers one-off. Common add-backs include owner compensation above a market salary, transaction and legal fees, restructuring and severance, costs of a plant move, a lawsuit settlement, and synergies from an acquisition not yet realized. A lender asks for the full list covering the trailing 24 months and reviews each item.
The main test is whether the cost will come back. A severance cost that appears once is non-recurring. A severance cost that appears in each of the last three years is a regular cost of running the business, even if each year’s is described as one-off. The same applies to consulting fees, recruiting costs and inventory write-downs. A lender also checks whether the adjusted EBITDA ties to cash actually collected. An add-back for a cost that was paid in cash still reduced the cash available that year.
Projected add-backs get the most scrutiny. Cost savings from an acquisition or a restructuring that have not yet happened are a forecast, and a lender usually accepts them only in part, or only once they appear in the results. The result of this probe is the EBITDA figure the lender uses for the rest of the numbers layer, including as the denominator for leverage in the next lesson.
From EBITDA to free cash flow
EBITDA leaves out several uses of cash that come before the lender is paid. The second probe subtracts them.
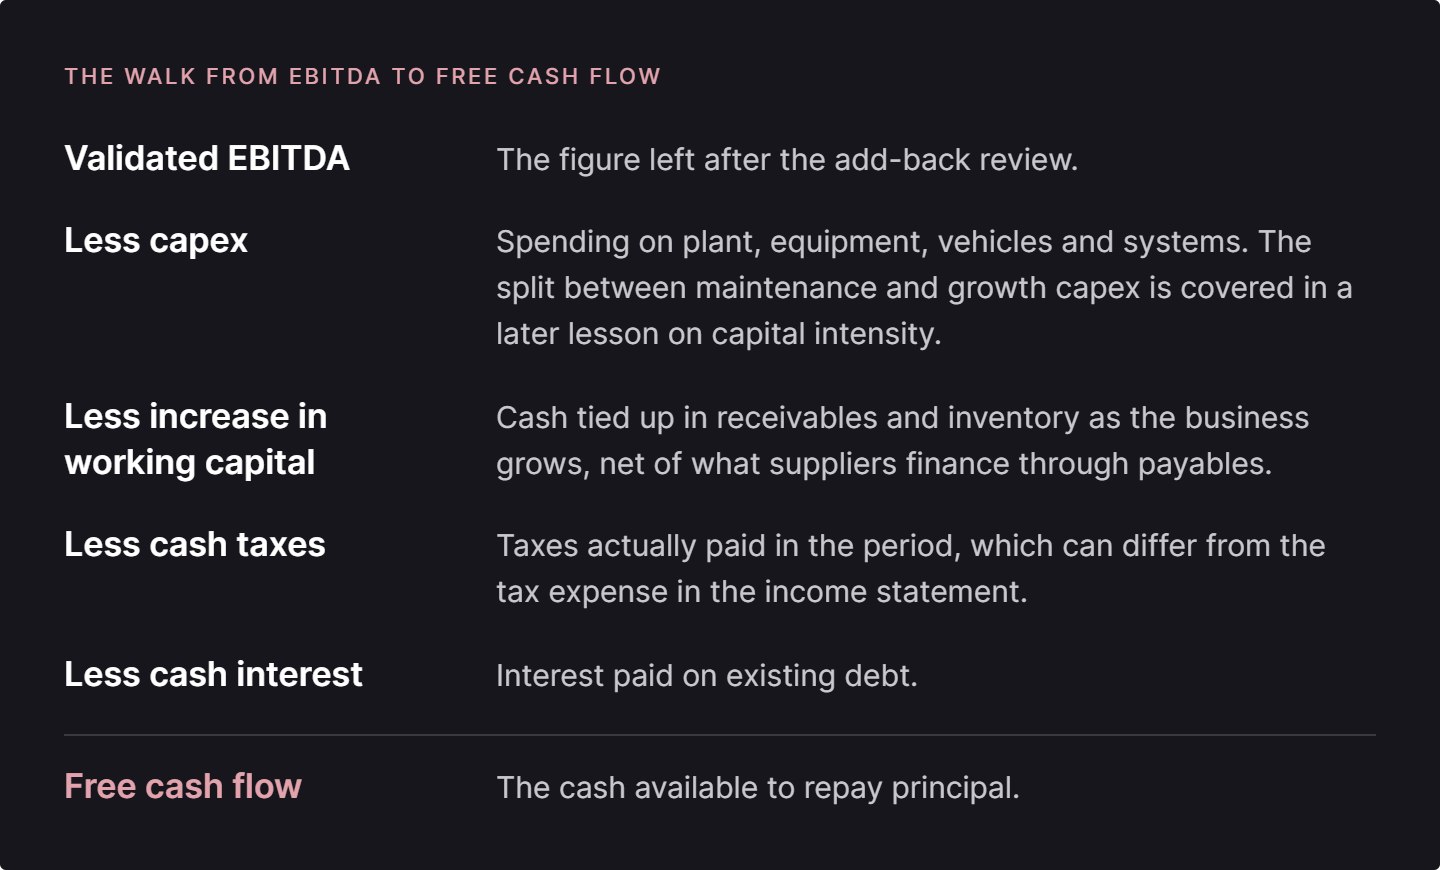
A lender reconciles the walk to the audited cash flow statement, so each line comes from a reported figure rather than an estimate. It runs the walk over several years, because conversion can vary a lot. A distributor growing quickly may convert less than half its EBITDA to free cash flow because receivables and inventory are growing with sales. A specialty contractor’s conversion may swing from year to year with the timing of billing on large jobs. The multi-year view shows a lender which conversion rate to use in its projection, and how much it could vary.
Coverage on the credit agreement’s definitions
The third probe calculates coverage the way the covenant will measure it. Credit agreements define both halves of the ratio. The cash flow definition sets which add-backs are allowed and whether any are capped. The fixed charge definition sets what is included alongside interest and scheduled principal, such as lease payments, capex, taxes or distributions. Two coverage figures for the same business can differ by a wide margin depending on those definitions.
A lender rebuilds the ratio independently on the definitions in its own proposed agreement. Where a borrower has an existing facility, the lender also rebuilds the coverage reported under that facility’s definitions, because a figure calculated on generous definitions can show headroom that disappears on stricter ones.
An illustrative schedule
The schedule below applies the first three probes to an illustrative borrower: a specialty distributor with $140mm of revenue. The same company is used in each lesson in this layer, so the figures carry forward. Management presents $12.0mm of adjusted EBITDA. The lender accepts four of the six add-backs in full or in part and arrives at $10.6mm. On the same capex, taxes and debt service, fixed charge coverage falls from 1.72 times to 1.44 times, against a covenant level of 1.20 times.
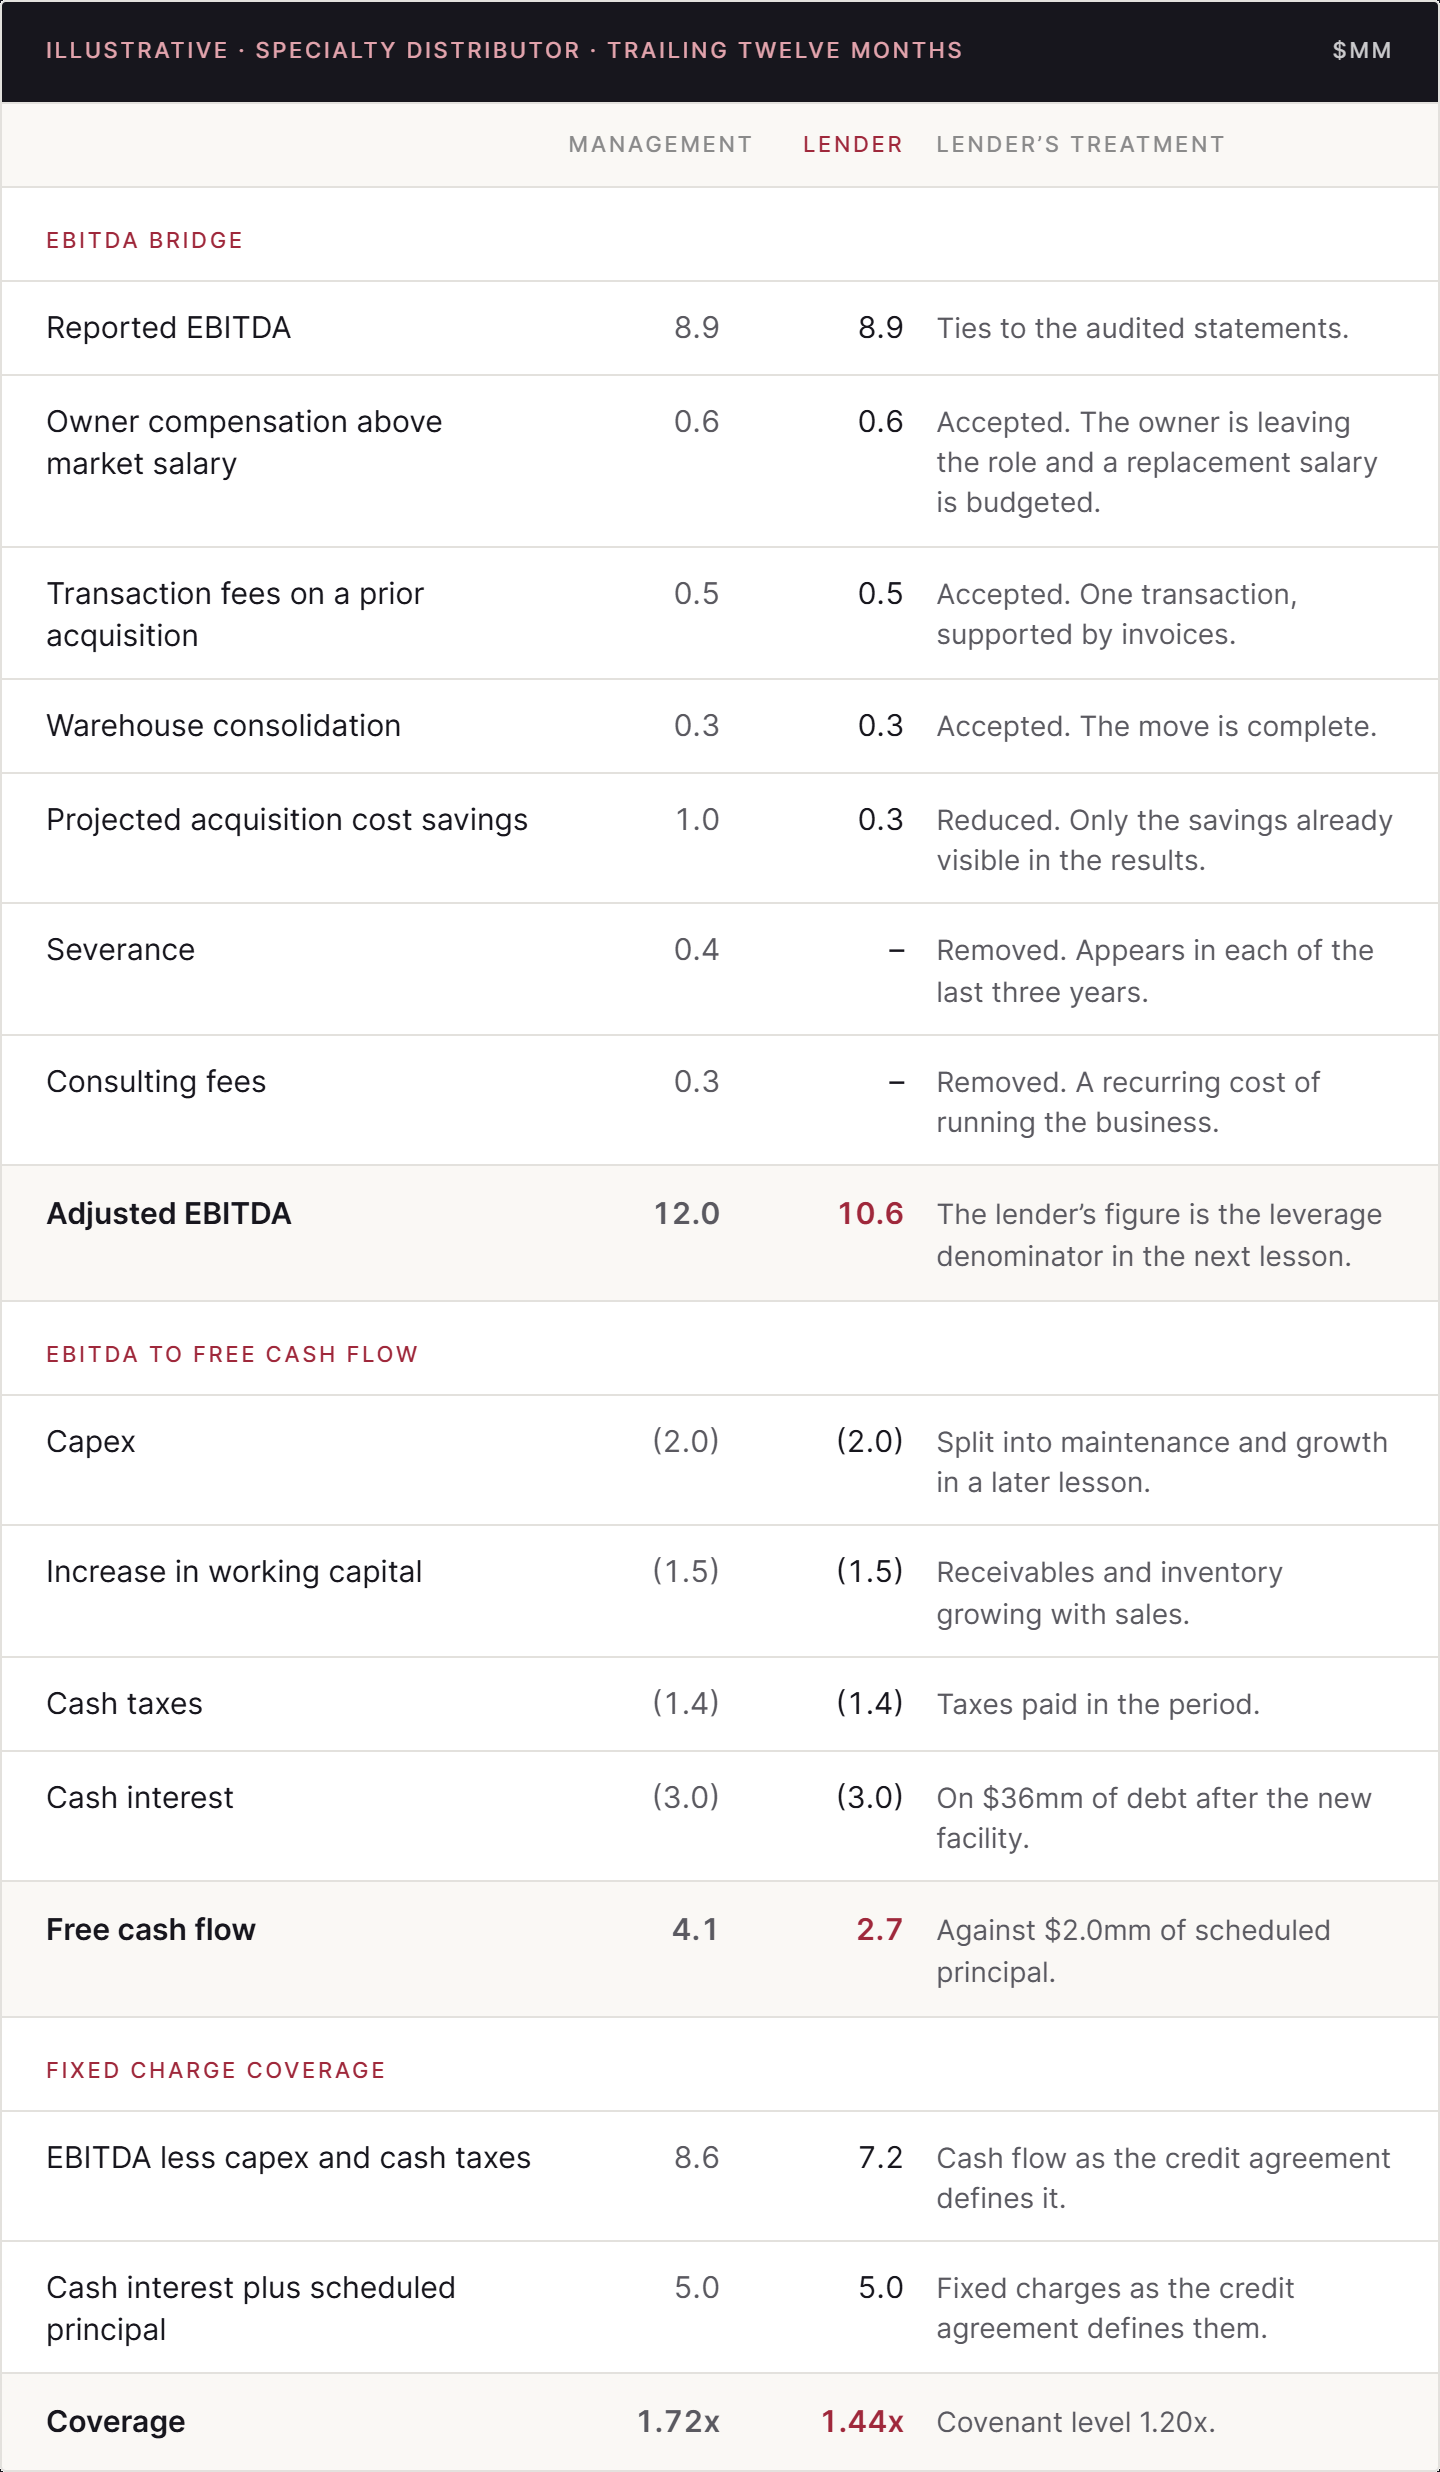
Each difference between the two columns comes from a single add-back, so a borrower that prepares the schedule itself can see roughly where a lender will land before the process starts.
Quarter to quarter
The fourth probe looks at cash flow by quarter over the trailing 8 to 12 quarters. An annual figure can hide a weak quarter, and covenants are usually tested quarterly on a trailing twelve-month basis. A lender separates normal seasonality, such as a landscaping contractor’s slow winter or a food manufacturer’s holiday build, from volatility that has no regular pattern. Seasonality is predictable and can be planned for in the covenant levels and the revolver. Irregular volatility is the kind that can cause a covenant breach in a quarter nobody expected.
Coverage in a downside
The fifth probe runs a lender’s downside case through to coverage. The question it answers is how far revenue and margin can fall before coverage drops below the covenant level. The downside is built from the durability findings rather than a flat percentage decline: the price concessions the buyer power work showed are likely at the next renewals, the input cost increase sized in the supplier power lesson, the volume at risk from the rivalry and substitutes work, and the delay in management’s response from the execution lesson.
The output is a figure a lender and a borrower can both discuss. For the distributor in the schedule, coverage reaches the 1.20 times covenant when cash flow falls to $6.0mm, so the lender’s EBITDA of $10.6mm can fall by about $1.2mm, or 11 percent, with capex and taxes held constant. If the downside built from the durability findings takes out $0.9mm, the remaining $0.3mm is the headroom. Headroom is one of the main inputs to the covenant levels and the loan amount, and on these figures it is thin.
For a borrower that is consuming cash
Coverage has no usable figure when EBITDA is negative. A lender replaces it with runway: the number of months the borrower’s cash lasts at the current rate of burn, set against the date of the next funding milestone, such as an equity raise, a product approval or breakeven. The quarterly series becomes a monthly burn trend, which shows whether the cash consumed each month is falling as planned. The downside case tests how long the cash lasts if the milestone slips or the next raise is delayed. The add-back review still applies, because a burn figure with costs excluded understates how fast the cash is being used. The lesson on the cash-consuming borrower covers this case in full.
What the cash flow and coverage read produces
At the end of this component a lender has five builds: an EBITDA bridge with each add-back accepted, reduced or removed, a walk from that EBITDA to free cash flow over several years, coverage on the credit agreement’s definitions, a quarterly cash flow series, and a downside case showing how far results can fall before coverage breaches.
That output is used in three places. The validated EBITDA is the denominator for every leverage ratio in the next lesson. The free cash flow is the primary source of repayment. And the downside case is carried into the repayment layer, where it is used to test whether the business can still be refinanced at maturity.
A borrower can prepare its own EBITDA bridge and cash flow walk before a lender asks for them. Which add-backs a particular lender will accept, which coverage definitions it will agree to, and how much headroom it will require against its downside case depend on what they have lent against before.
Next in the series
Leverage: the debt multiple before and after the new loan
Current and pro forma leverage at closing, including debt-like instruments and obligations such as leases, seller notes and earnouts.
You can build your own EBITDA bridge and free cash flow walk. Knowing which add-backs the lenders in your process will accept, and negotiating the definitions the covenant uses, is the part I do at Synthase Capital Partners.