


Part of The Underwriter’s Read, a series on the critical questions a credit team works through before they lend.
Porter defined rivalry as competition among existing firms in an industry, and his analysis is about the industry’s structure rather than any one company’s position in it. Some industries push their participants toward cutting price whenever volume softens; others let them compete on service, specification or delivery and hold margin. A lender needs to know which kind of industry the borrower is in before reading the borrower’s own numbers, because the structure sets how much pressure will be applied over the term of the loan.
This lesson works in two steps. The first reads the industry against Porter’s conditions for intense rivalry. The second uses the borrower’s data to establish whether that rivalry is reaching its revenue: how the growth rate compares with the market, how much of it was acquired, how much came from price versus volume, what the largest competitors can afford to do, and what the leading indicators show.
Management’s plan usually holds realized price and gross margin roughly flat while volume grows. In an industry with high fixed costs, slow growth and little differentiation, Porter’s framework says the participants will trade price for volume when demand softens, and a plan that assumes otherwise is assuming the borrower is the exception. The rivalry read lets a lender set the price assumption in the base and downside cases from the industry’s structure and the borrower’s own price history, rather than from management’s target margin.
What makes rivalry intense
Porter set out the conditions under which rivalry is most intense. Each is a fact about the industry that a lender can establish without the borrower’s internal data.
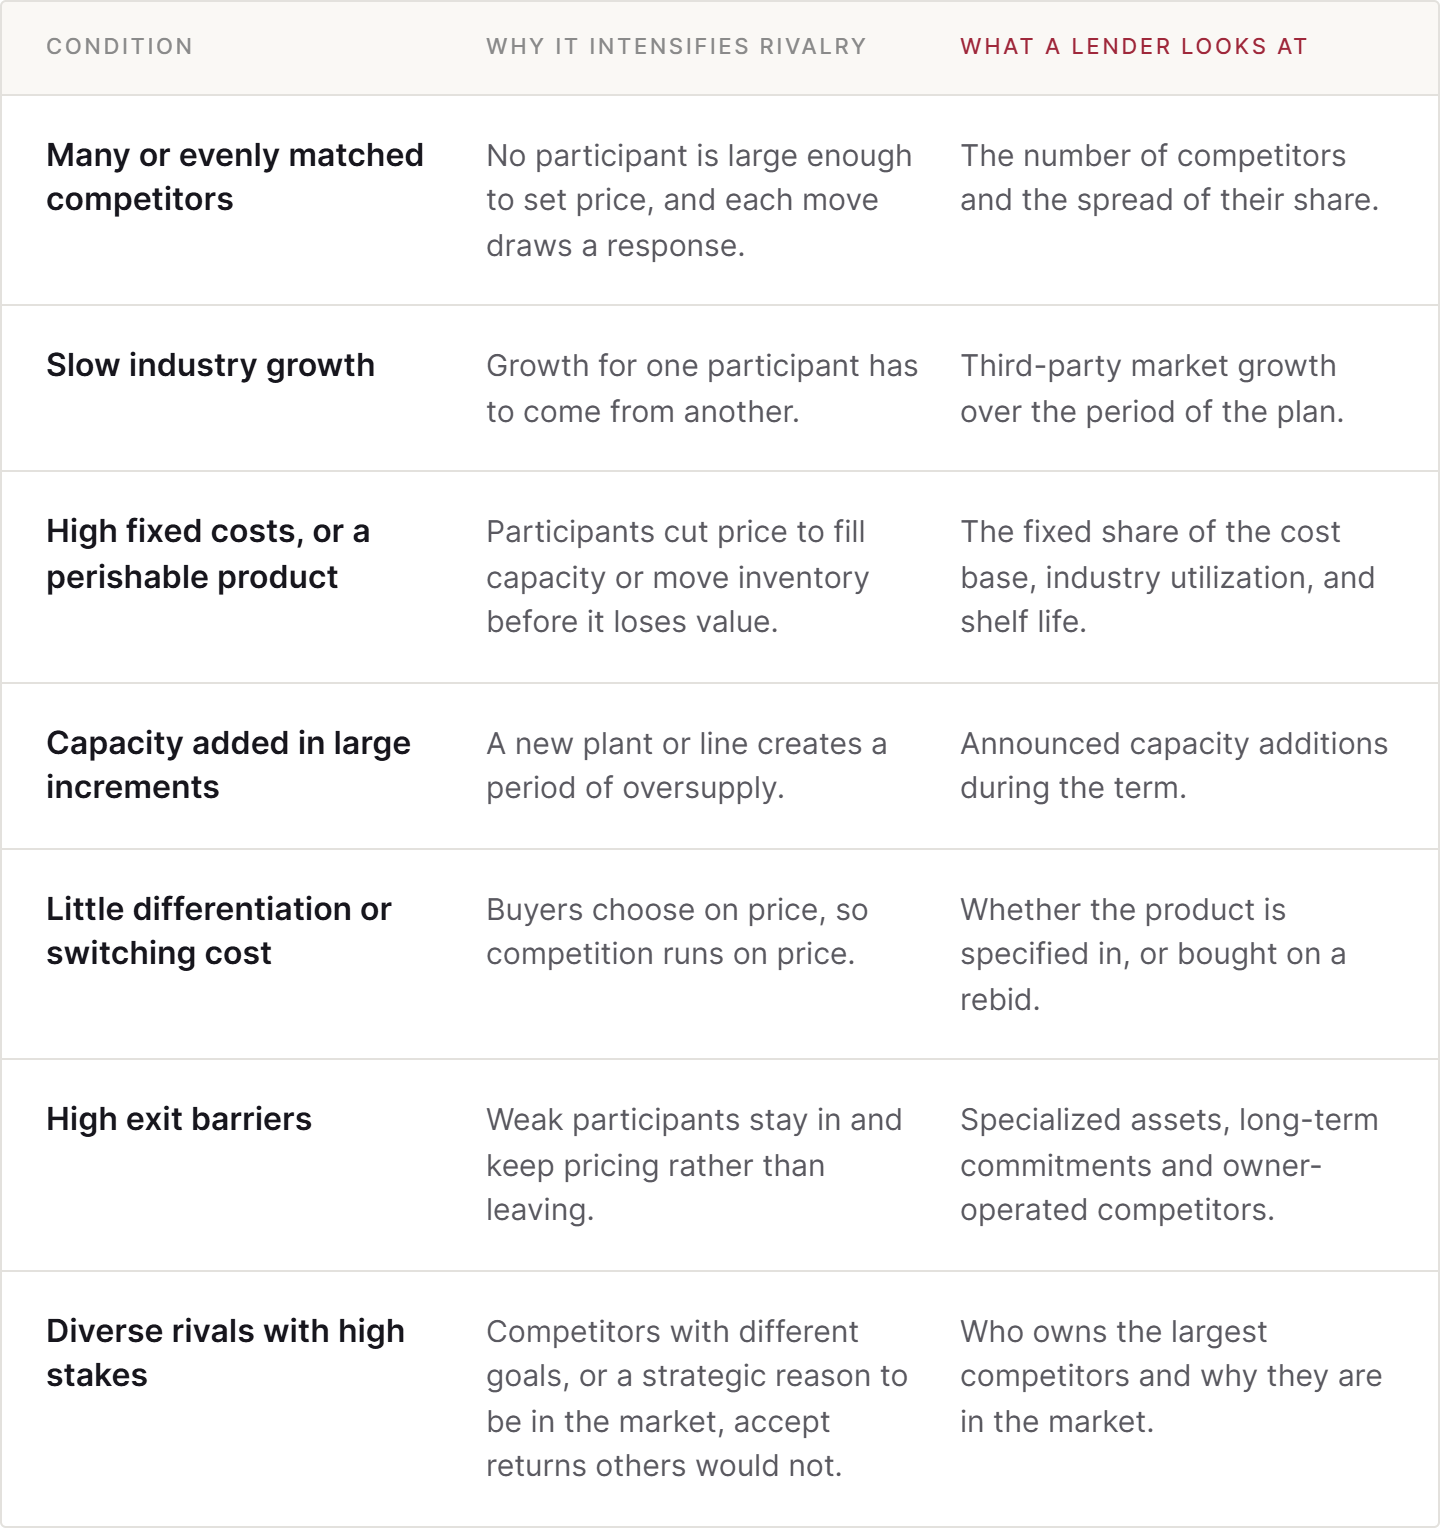
Porter also distinguished rivalry on price from rivalry on other dimensions. Price competition transfers margin directly to customers and is easy for a competitor to match, so it tends to lower returns for the whole industry. Competition on features, service, delivery time or brand is harder to copy and can leave margins intact. He noted that price competition is most likely when products are close to identical, switching costs are low, fixed costs are high relative to marginal costs, capacity comes in large increments, and the product is perishable. For a lender, the useful output of this step is a plain finding on which kind of competition the borrower’s industry runs on.
Two of the conditions connect to earlier work. High fixed costs are the same fixed-cost floor established in the [cost structure read](https://www.thecreditbubble.com/p/cost-structure-how-much-of-the-cost), applied now to competitors as well as the borrower. Exit barriers matter in a downturn: competitors that cannot sell their assets or walk away from their commitments keep producing and pricing to cover cash costs, which extends the period of weak pricing.
Whether it is reaching the borrower
Five probes establish how much of the pressure the industry read predicts is already showing up in the borrower’s numbers.
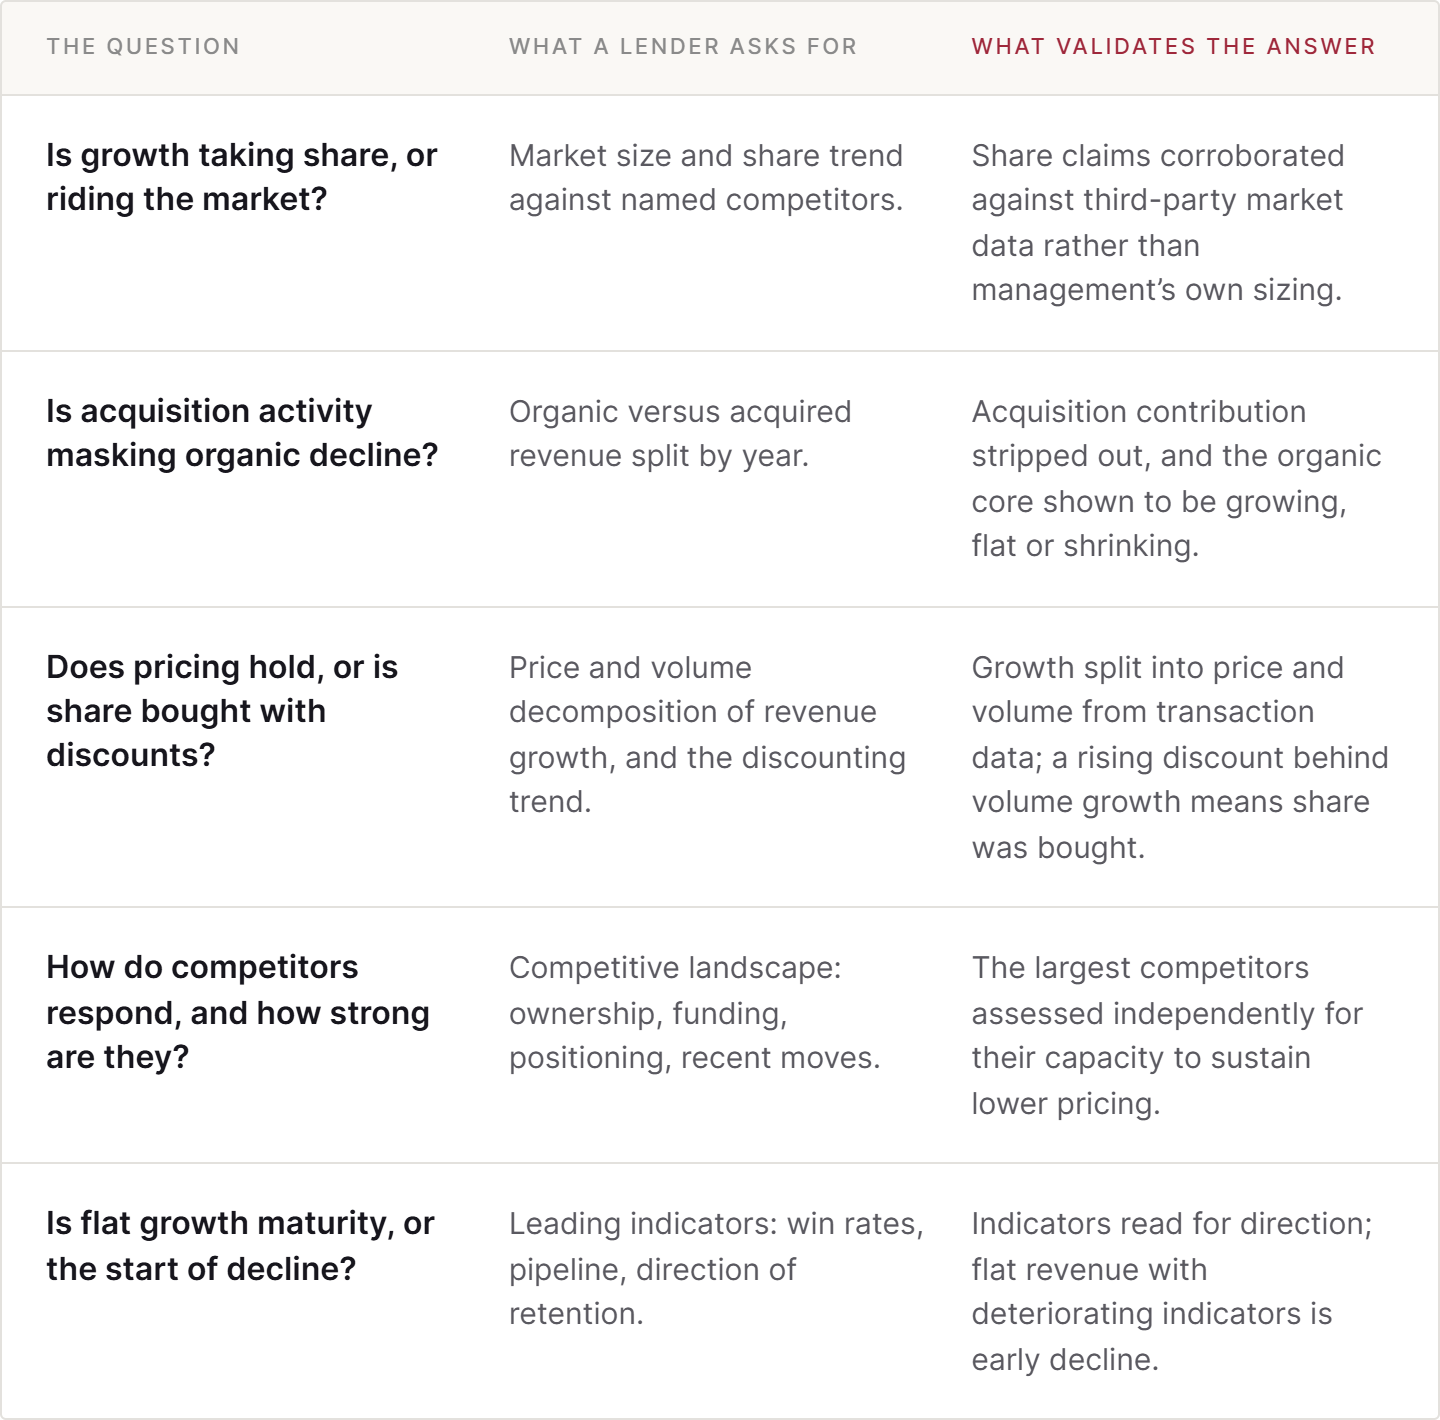
The market comparison uses the same industry growth figure as the structural read, applied to the borrower. A distributor growing nine percent in a market growing twelve percent is losing share while reporting growth. This is also where management’s own market sizing is replaced with a third-party number, because a borrower that defines its market narrowly enough can show share gains in any conditions.
The organic split applies to borrowers that have been acquiring. A fabricator that bought two competitors over three years reports the combined revenue, and the growth rate contains both the acquired revenue and whatever the original business did. A lender needs the two separated by year. In a slow-growth industry, acquisition is a common way to report growth while the underlying business is flat, and growth that depends on further acquisitions depends on further capital.
The price and volume decomposition is the direct test of whether price competition is reaching the borrower. It comes from transaction data: units and realized price per unit, by product line and period.
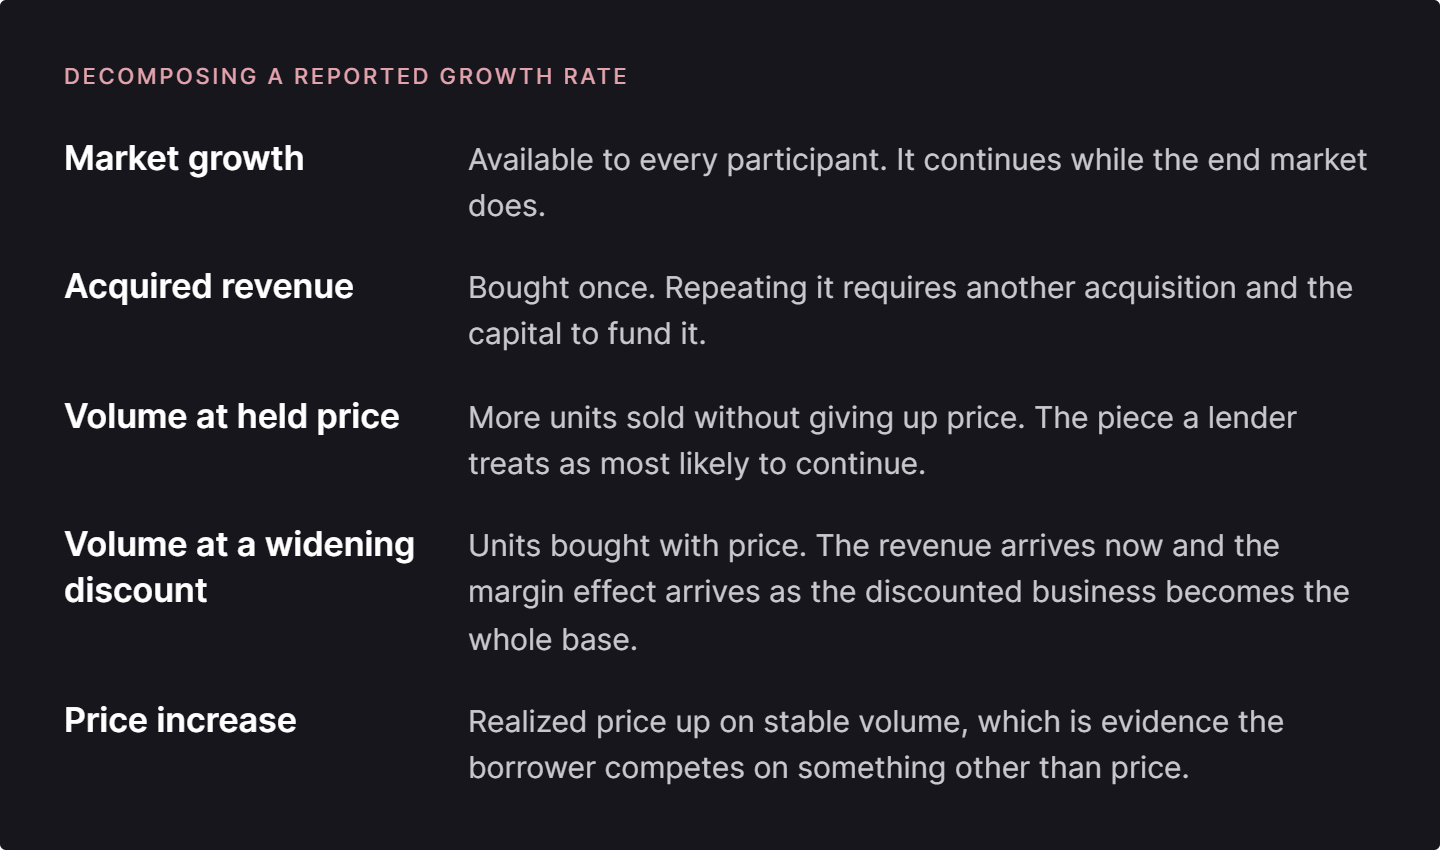
A specialty contractor bidding at progressively thinner margins to keep the crews busy shows revenue growth and a falling realized price. That is the pattern Porter describes in a high-fixed-cost industry, visible in one company’s numbers. The share gained this way is easy to reverse, because a competitor that wants the work back only has to match the price.
The competitor assessment applies Porter’s point about diverse rivals with high stakes to named companies. A lender is looking for which competitors have the balance sheet, the ownership or the strategic reason to sustain below-margin pricing: a sponsor-backed consolidator in a fragmented market, a public company defending a segment, a larger supplier moving downstream. Recent moves are read the same way: a new plant, a territory expansion, a recapitalization. The assessment is about capability over the term rather than current behavior.
The leading indicators address flat revenue. Flat revenue in a mature industry with stable share is a different credit from flat revenue that is the first year of a decline, and the reported number does not distinguish them. Win rate on bids and rebids, pipeline coverage against the plan’s new-business target, and reorder rates by customer vintage move one or two periods ahead of revenue. These reuse the data assembled for [the read on what keeps customers](https://www.thecreditbubble.com/p/customer-relationships-what-keeps). Win rate is the one most borrowers cannot produce, because it requires tracking losses as well as wins.
What the rivalry read produces
At the end of this component a lender has a finding on how intense rivalry is in the borrower’s industry and whether it runs on price, the reported growth rate broken into market, acquired, volume and price, a named list of competitors with an assessment of what each can afford to do, and a direction of travel from the leading indicators.
That output is used in three places. The industry finding and the price history set the price assumption in the downside case, and give the decline in that case a cause. The price and volume work tests the margin assumptions in the plan. And the combined verdict feeds the view on whether the business will be financeable at maturity, since a lender refinancing the borrower at that date will run the same read on the industry as it stands then.
A borrower can describe its industry against Porter’s conditions and run the decomposition on its own transaction data. Whether a particular lender treats price-based rivalry as a margin risk to be covenanted, a known feature of an industry they lend into regularly, or a reason to shorten the tenor depends on what they have lent against before.
Next in the series
Buyer power: what lets customers set the price
How concentrated the customers are, what it costs them to switch, and how much the purchase matters to their own costs.
You can read your industry against Porter’s conditions and decompose your own growth rate. Reading how a particular lender will treat what that shows, and what it does to the terms you are offered, is the part I do at Synthase Capital Partners.