


Part of The Underwriter’s Read, a series on the critical questions a credit team works through before they lend.
The first three layers of the series covered what the borrower is asking for, how the business makes money, and what could change that over the term of the loan. The numbers layer puts those findings into the financial model.
This layer asks whether the business can service the debt. The borrower’s financial statements and projections already show EBITDA, leverage and coverage. A lender rebuilds each figure from the source documents, adjusts it for what the earlier work found, and takes its own figures to credit committee.
A lender also builds its own base case and downside case here, instead of relying on management’s projections. The model layer supplies the base case assumptions, such as how much revenue is contracted and which costs are fixed. The durability layer supplies the downside: which customers could push price down, which input costs could rise, and which competitors could take volume.
Five components, and what each one tests
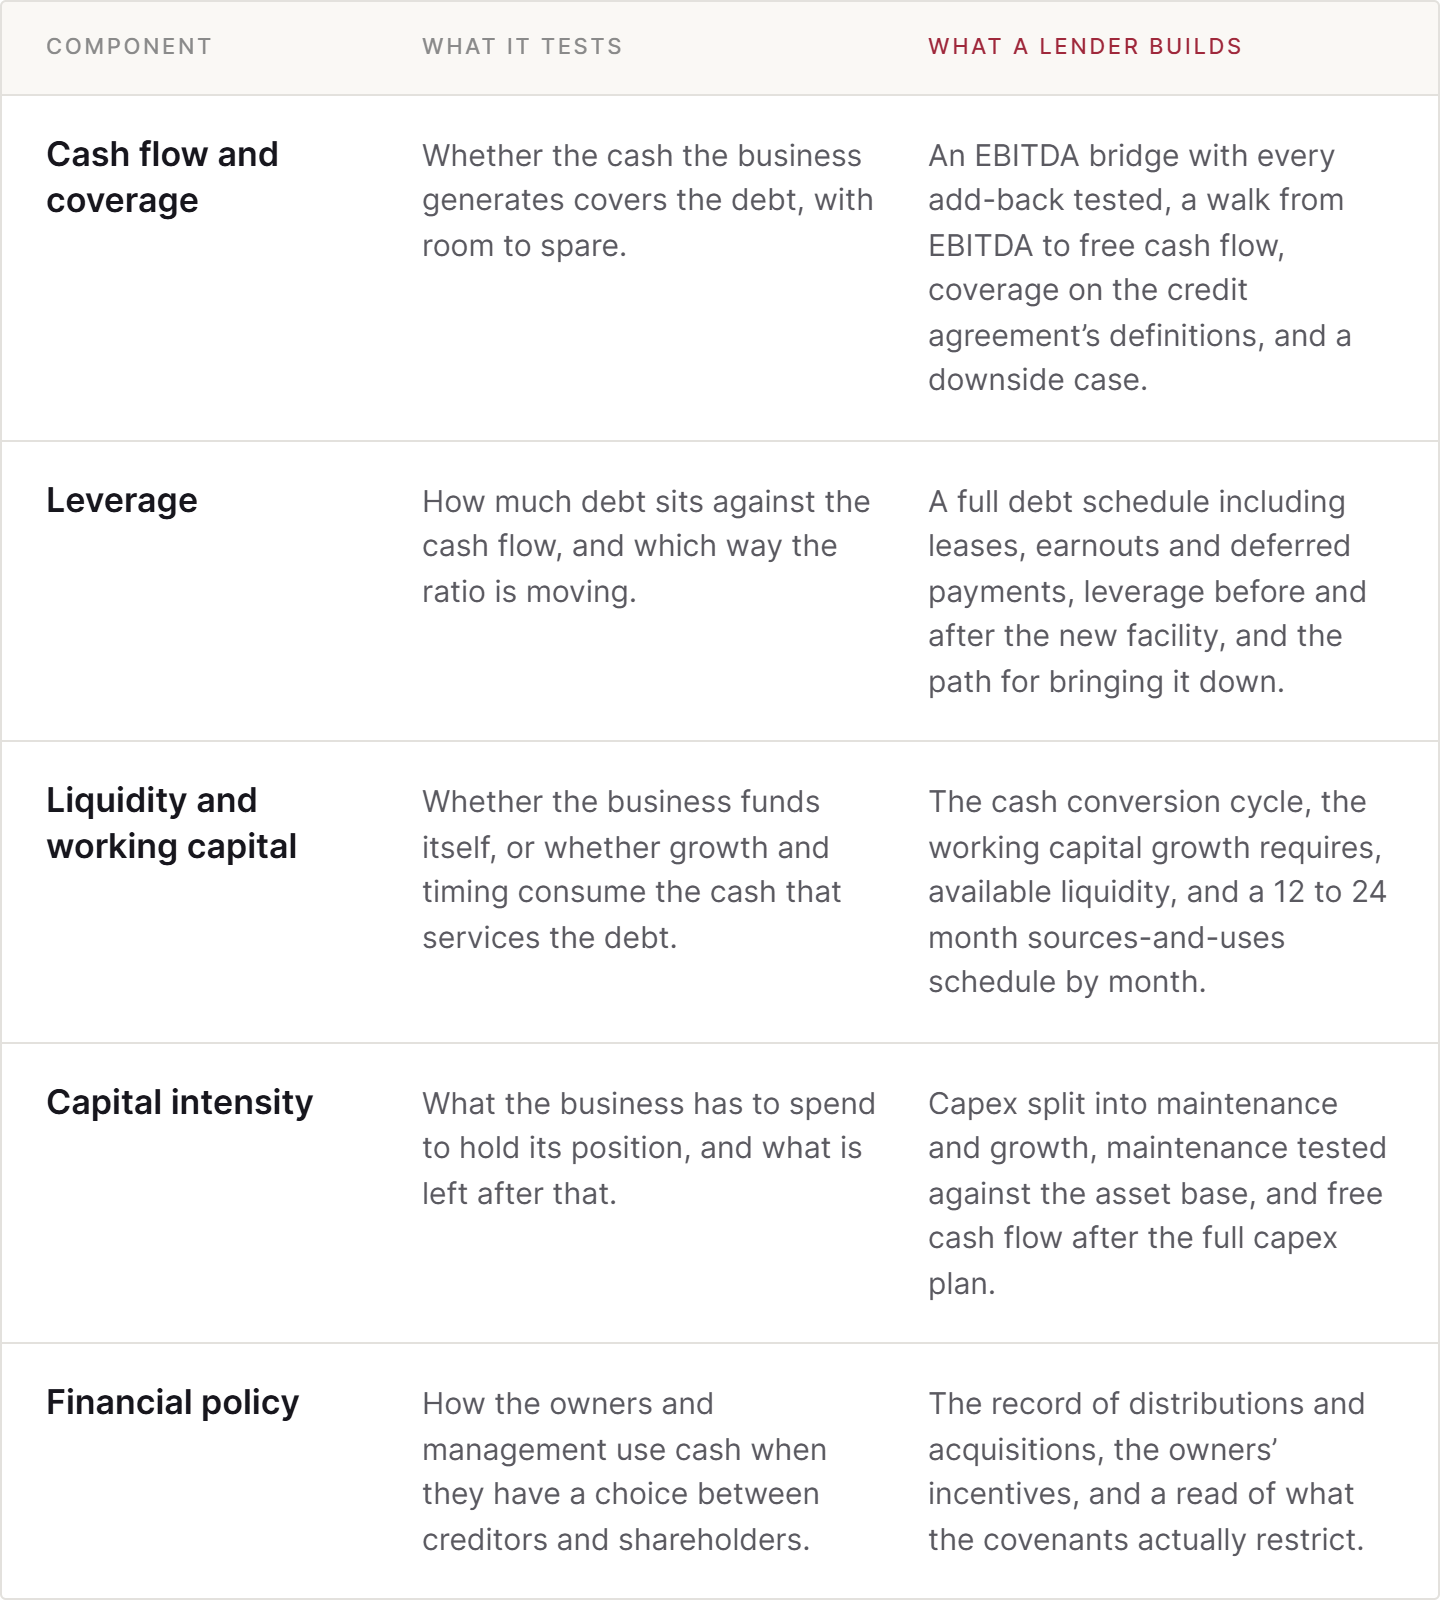
Cash flow and coverage, leverage, and liquidity get the full treatment for every borrower. Together they show whether the debt can be paid and how much room there is if results fall short. Capital intensity and financial policy get less attention unless something earlier flagged them, such as a plant near the end of its useful life, a sponsor near the end of its hold period, or an owner who has taken distributions ahead of paying down debt.
The lessons publish in the order the builds depend on each other: cash flow and coverage, leverage, liquidity and working capital, capital intensity, financial policy. The EBITDA figure from cash flow and coverage is the denominator for every leverage ratio. Working capital needs from the liquidity work go into the free cash flow calculation, and maintenance capex determines how much of that free cash flow is left for debt service.
Where the inputs come from
Each component draws on findings from earlier lessons.
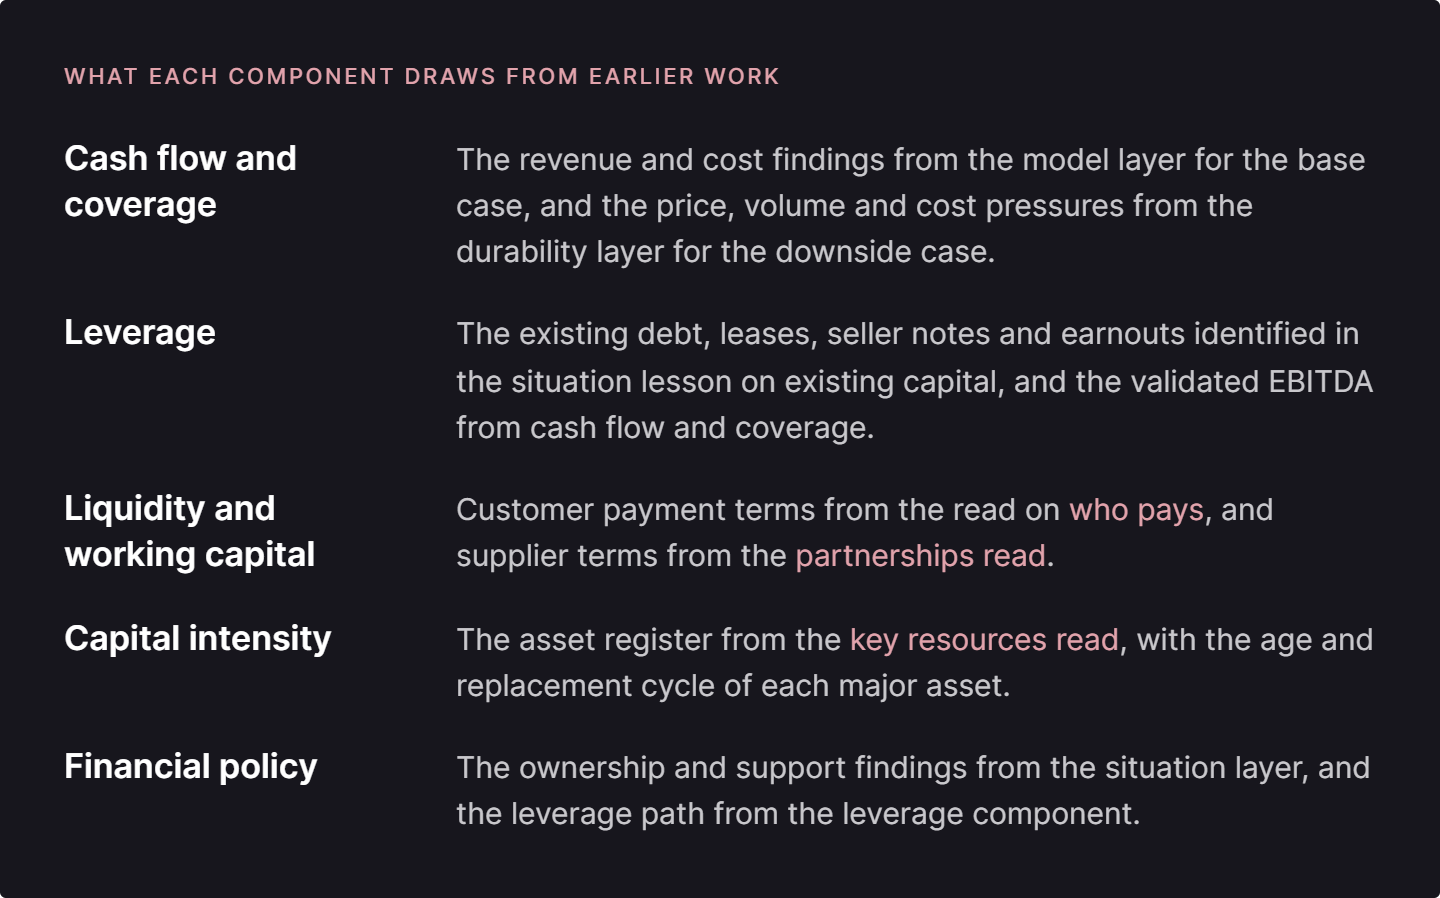
The durability findings go mainly into the downside case. Instead of assuming a flat twenty percent revenue decline, a lender can model specific events: a price concession at the next rebid with the two largest customers, two quarters of higher input costs before they are passed on, and the volume a competitor’s new plant could take. Each line can be traced to the lesson that produced it.
Borrowers that do not yet generate cash
Most of this layer assumes the borrower has positive EBITDA. Coverage and leverage both use EBITDA, so neither gives a usable figure for a borrower that is still consuming cash, such as a venture-backed company before profitability or a business partway through a large build-out. These borrowers are a minority of deals, and lenders assess them differently.
A loan to a cash-consuming borrower is repaid from cash on the balance sheet, the next equity raise, a sale of the company, or the business reaching breakeven before maturity. A lender measures how many months the cash will last and what event is expected to extend it.
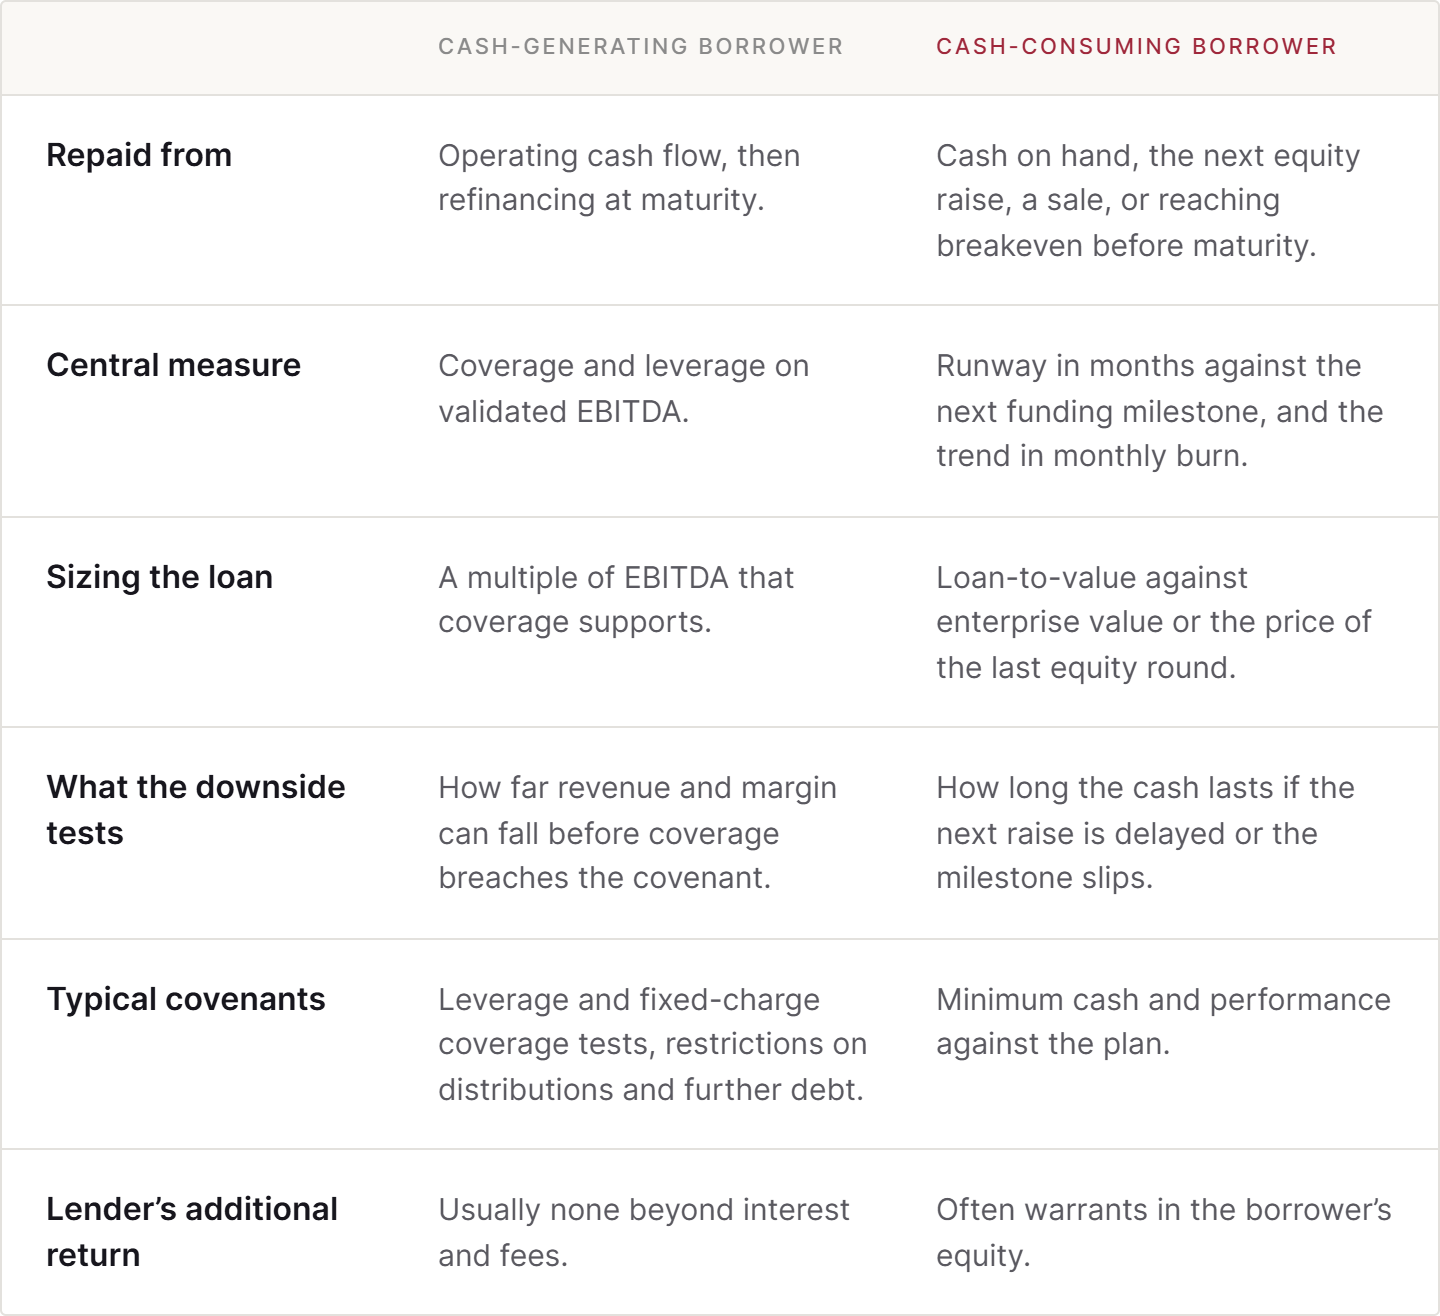
Liquidity and working capital applies to both types of borrower as written, and its monthly sources-and-uses schedule is the main build for a cash-consuming borrower. Each of the five lessons in this layer includes a paragraph on how its component applies to a cash-consuming borrower, and a separate lesson after the five covers that case in full.
What the layer produces
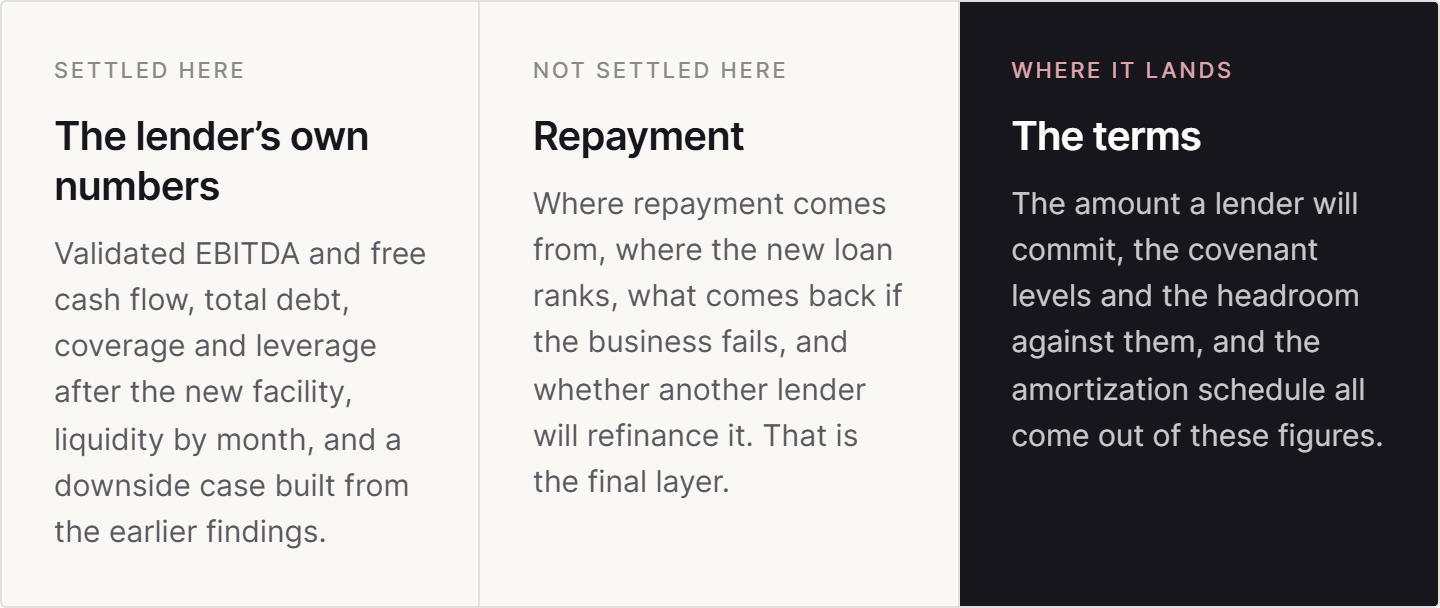
Covenant levels come from this layer. A lender sets leverage and coverage tests with headroom against its own base case, and sizes that headroom using its downside case. Two borrowers reporting the same adjusted EBITDA will be offered different covenant levels if the lender accepts one borrower’s add-backs in full and cuts the other’s by a third.
Which EBITDA figure to present
A borrower that reports adjusted EBITDA has to decide which figure to lead with. The adjusted figure sets the leverage multiple a lender sees first and the loan amount the borrower can ask for. A lender tests every add-back, and if it removes some of them, it becomes more cautious about the rest of the package.
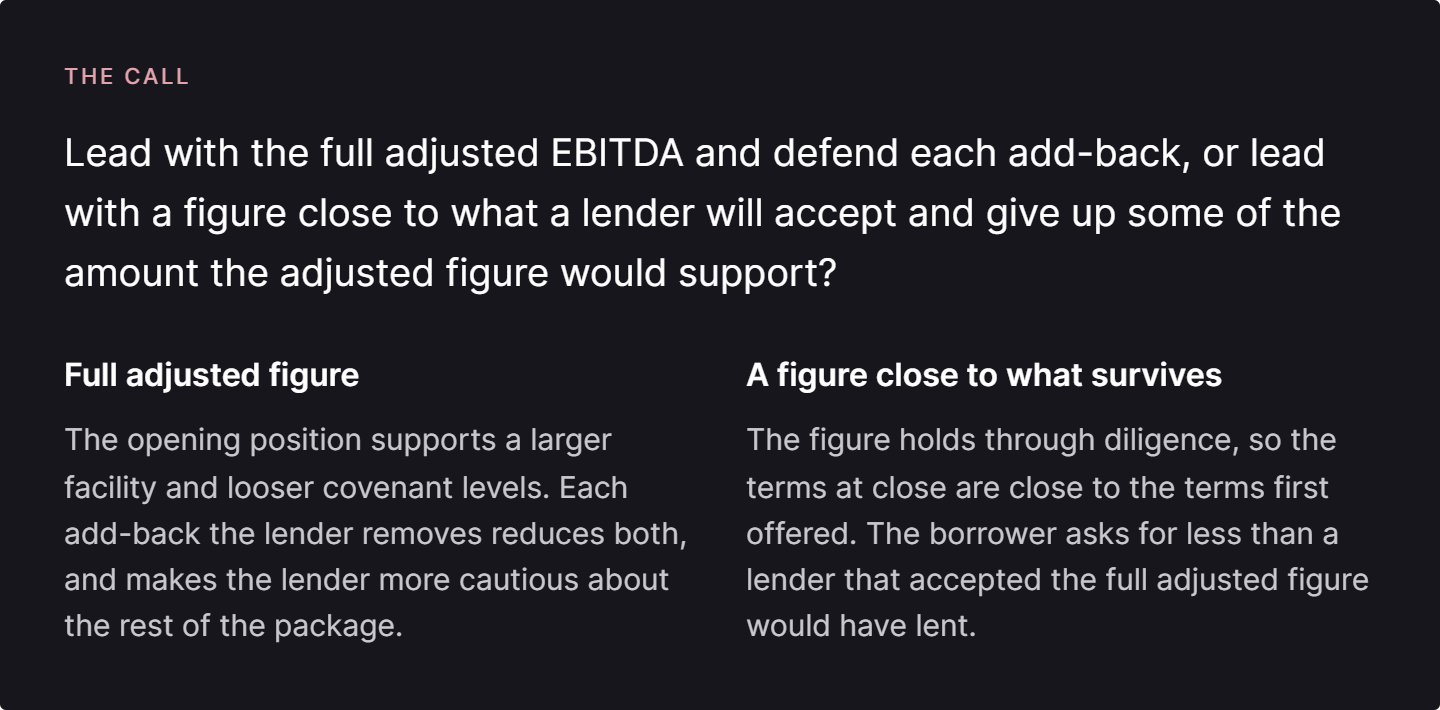
Which approach works better depends on facts outside the business: which lender types are in the process and how each one treats add-backs, how the lenders in the process treated similar add-backs in recent deals, whether the credit agreement definitions of EBITDA are open to negotiation, and what leverage comparable credits have closed at recently.
Next in the series
Cash flow and coverage: how much of the reported EBITDA is cash the debt can be paid from
Testing each add-back, walking EBITDA to free cash flow, and rebuilding coverage on the credit agreement’s own definitions.
You can build your own EBITDA bridge and liquidity schedule. Deciding which EBITDA figure to lead with, and how the lenders in your process will read it, is the part I do at Synthase Capital Partners.