


Part of The Underwriter’s Read, a series on the critical questions a credit team works through before they lend.
Liquidity is the cash a borrower can use to meet its obligations as they fall due: cash on hand plus undrawn committed facilities. Working capital is the cash tied up in receivables and inventory, less the amount suppliers finance through payables. A profitable borrower can run short of cash if receivables and inventory grow faster than earnings, or if the cash balance falls during the year to a level the year-end figure does not show. The lessons on cash flow and coverage and leverage measured the business over a full year. A lender measures liquidity month by month.
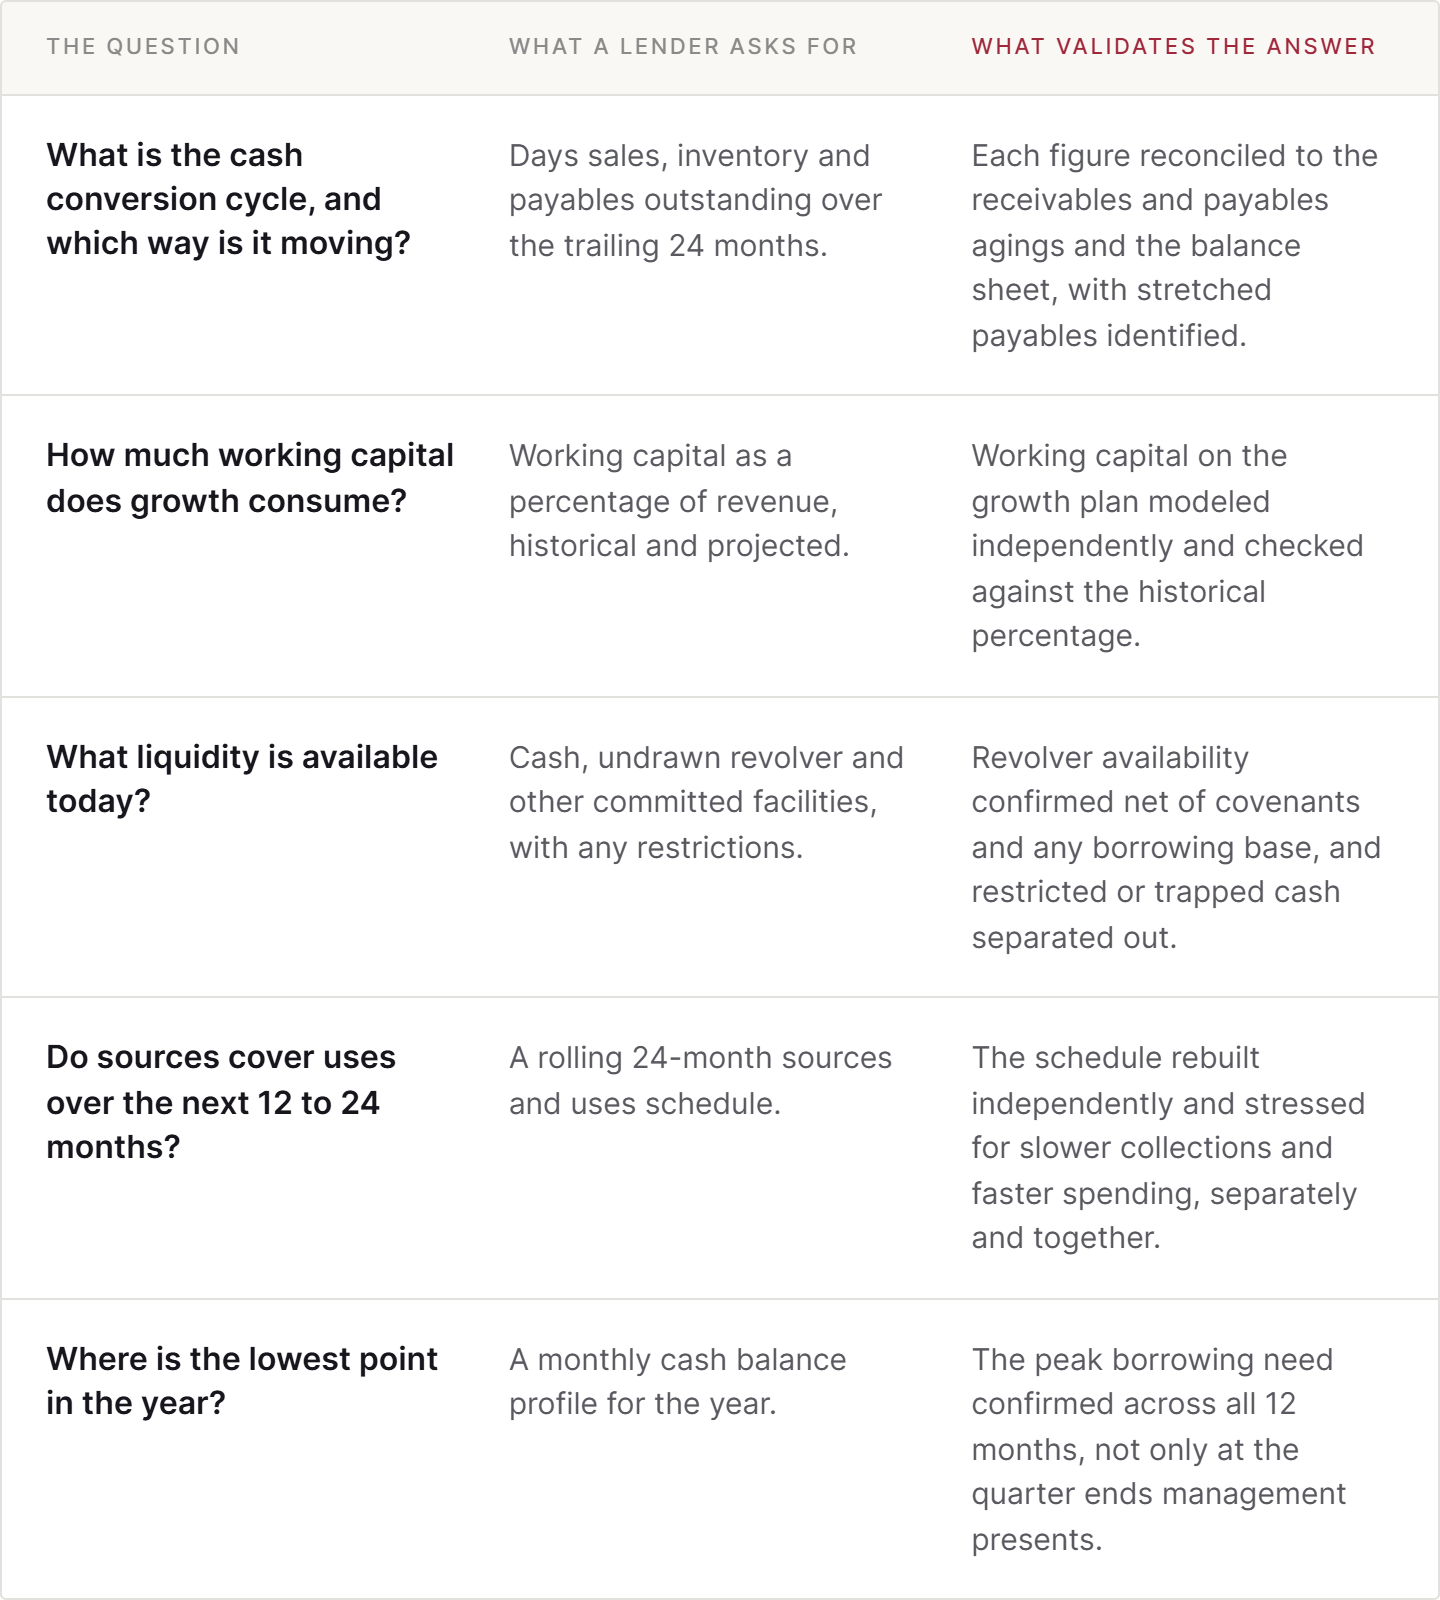
Five probes sit in this component. The first measures the cash conversion cycle and its trend. The second sizes the working capital that growth consumes. The third establishes the liquidity available today. The fourth tests whether sources of cash cover uses over the next 12 to 24 months. The fifth finds the lowest point in the cash balance during the year.
Management’s projection usually shows cash at each year end, with working capital growing in line with revenue. A lender rebuilds working capital from the historical days of receivables, inventory and payables, and rebuilds the cash balance month by month from its own cash flow figure. That lets the lender establish whether the forecast includes the cash that growth will tie up, and whether the borrower can service the debt in the lowest month of the year as well as at year end.
The five probes, and what validates the answer
The cash conversion cycle
The first probe measures the cash conversion cycle, the number of days between paying suppliers and collecting from customers. It has three parts. Days sales outstanding is how long customers take to pay. Days inventory outstanding is how long stock sits before it is sold. Days payables outstanding is how long the business takes to pay its suppliers. The cycle is the first two added together, less the third. A lender asks for each over the trailing 24 months and reconciles them to the receivables and payables agings and to the balance sheet.
A lender looks at the trend in each part as well as the total. A cycle that shortens because payables have stretched from 30 to 35 days may mean the borrower is paying suppliers later than agreed. A lender checks whether suppliers agreed to the longer terms. If they did not, the cash that stretched payables provide can reverse, and suppliers can tighten terms or credit limits.
What growth ties up
The second probe sizes the working capital that growth consumes. A lender takes working capital as a percentage of revenue from the history and applies it to the growth plan. At 17.5 percent, each $10.0mm of new revenue ties up about $1.75mm of cash in receivables and inventory, net of payables, before that revenue is collected. A borrower growing quickly can put more cash into working capital than it earns in the year. The lender checks that the projection uses a percentage consistent with the history.
Liquidity available today
The third probe establishes total available liquidity: cash on hand, the undrawn part of the revolver, and any other committed facility. A lender adjusts each for restrictions. Cash held in a foreign subsidiary, or pledged against a letter of credit, may not be available to service the debt. Revolver availability is limited by the financial covenants and, for an asset-based revolver, by the borrowing base, which lends against a percentage of eligible receivables and inventory. An undrawn commitment set aside for a specific purpose, such as a capital project, is available only for that purpose.
An illustrative schedule
The schedule below continues the specialty distributor from the lessons on cash flow and coverage and leverage. The borrower has revenue of $140.0mm and cost of goods sold of $105.0mm. Over the last 24 months, customers have gone from paying in 42 days to 45 days, inventory has improved from 62 days to 60, and payables have stretched from 30 days to 35.
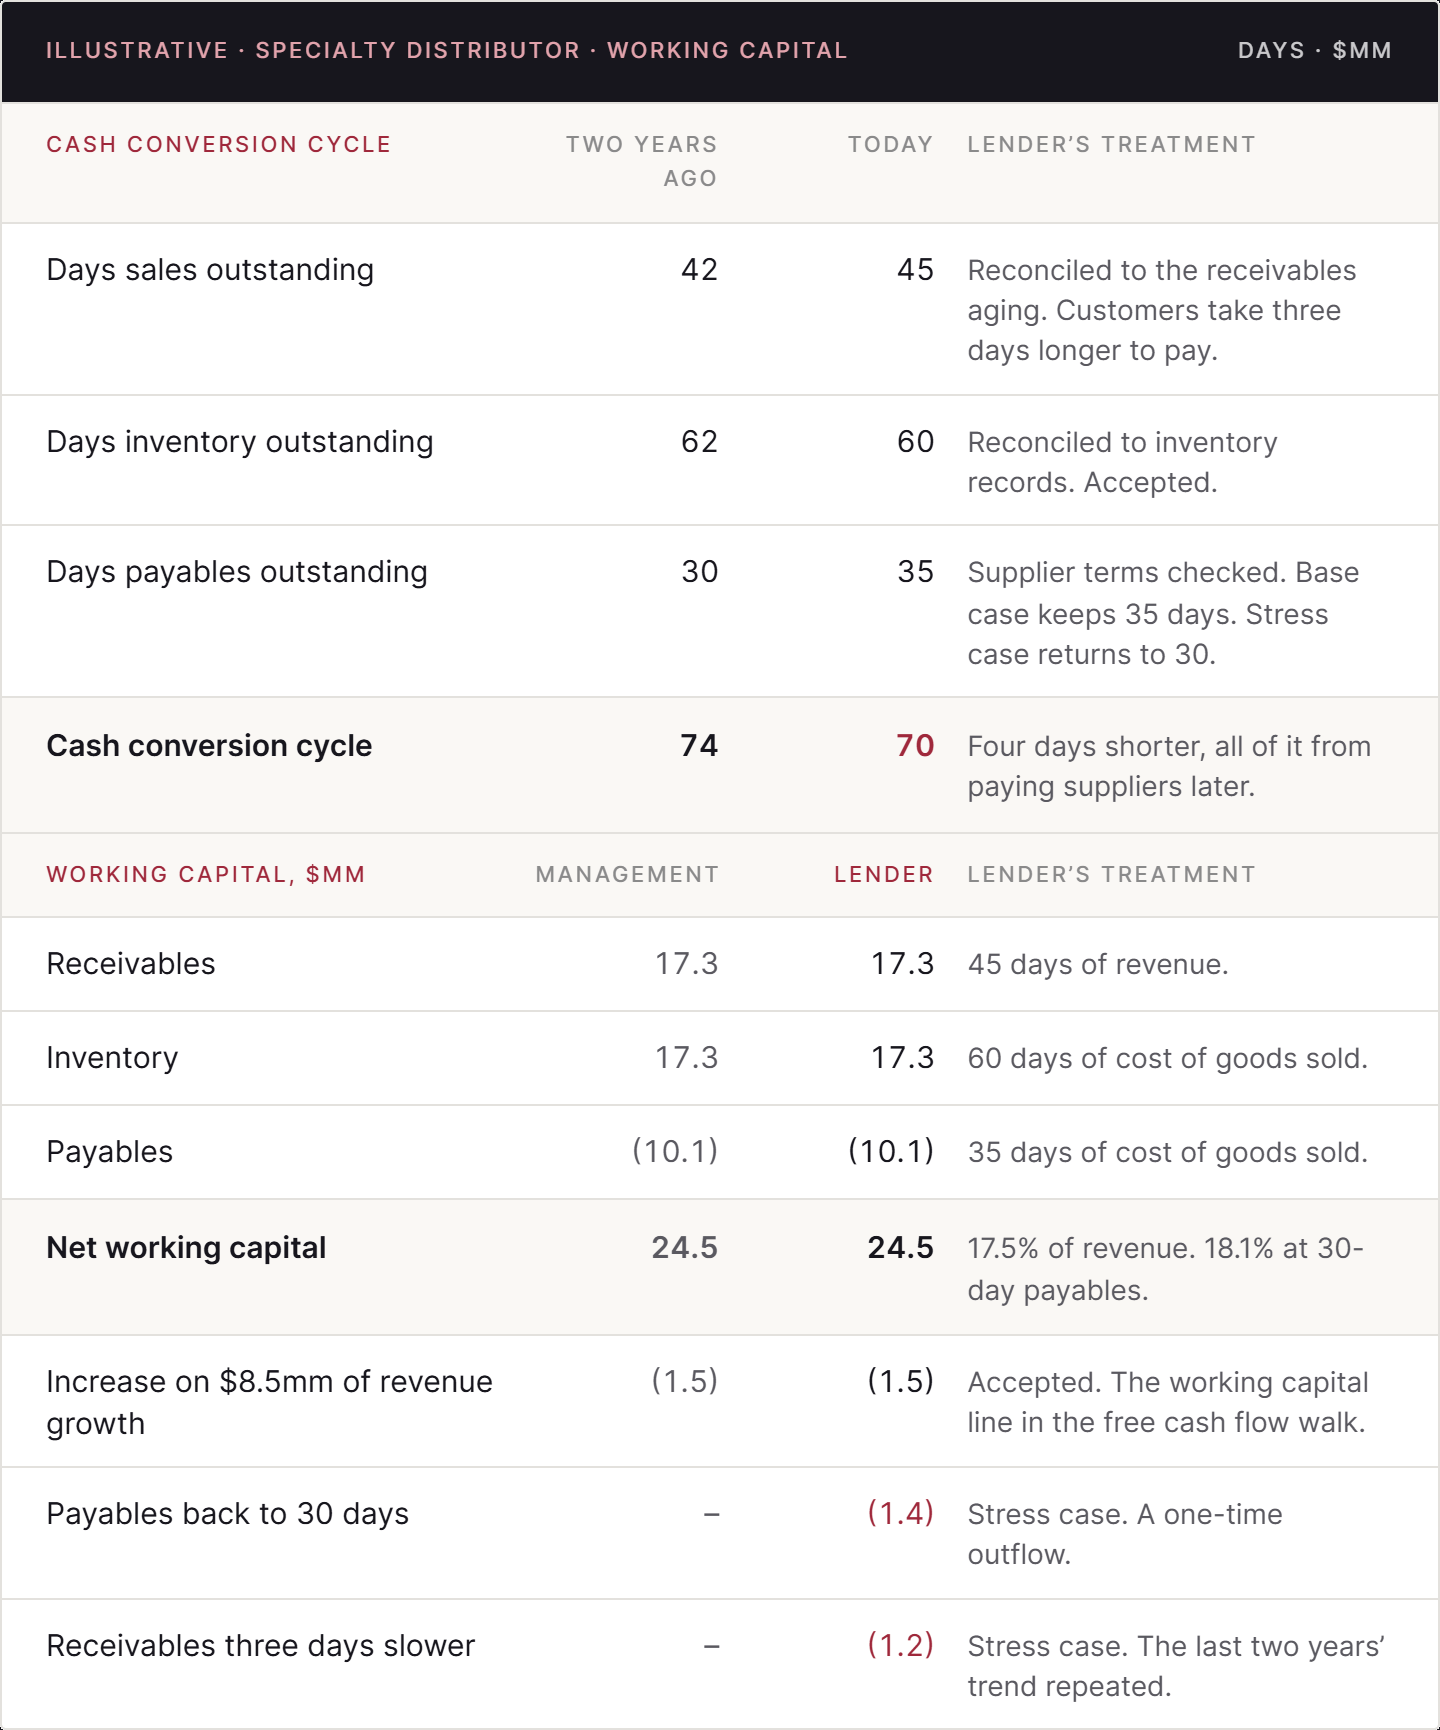
The cash conversion cycle has shortened by four days, and all of the improvement comes from paying suppliers later, while customers have slowed. Working capital is 17.5 percent of revenue today, and would be 18.1 percent on the payable terms of two years ago. Management plans revenue growth of $8.5mm next year, which at 17.5 percent ties up about $1.5mm, the working capital figure used in the cash flow lesson. The lender accepts that figure for its base case. If suppliers return the business to 30-day terms, the borrower pays out about $1.4mm once, on top of the growth figure.
Sources and uses over the next 12 to 24 months
The fourth probe builds sources and uses of cash over the next 12 to 24 months. Sources are cash from operations and available facilities. Uses are working capital, capital spending, debt service and other committed payments, such as an earnout or deferred purchase price. For the distributor, the $1.0mm of deferred purchase price falls due in month 18, inside the 24-month window. A lender rebuilds management’s schedule on its own cash flow figure and then stresses it for slower collections and faster spending, separately and together.
The lowest month
The fifth probe looks at the cash balance within the year. Management usually presents cash at quarter ends, and a quarter-end figure can sit above the lowest point in the quarter. A seasonal business builds receivables and inventory ahead of its peak and collects afterwards, so the low point usually falls just before collections come in. A lender asks for a monthly cash profile and identifies the peak borrowing need across all 12 months.
For the distributor, the $33.0mm facility repays $24.0mm of existing debt and pays $1.0mm of fees at closing. The remaining $8.0mm is drawn as the new branch is built and stocked between February and August. Liquidity at closing is $10.0mm: $2.0mm of cash and $8.0mm of undrawn commitment, all of it set aside for the branch. The facility has no other availability, so the seasonal build in receivables and inventory is funded from cash and from operations. The schedule uses the lender’s figures: $10.6mm of EBITDA less capex, cash taxes and cash interest gives $4.2mm of cash from operations for the year.
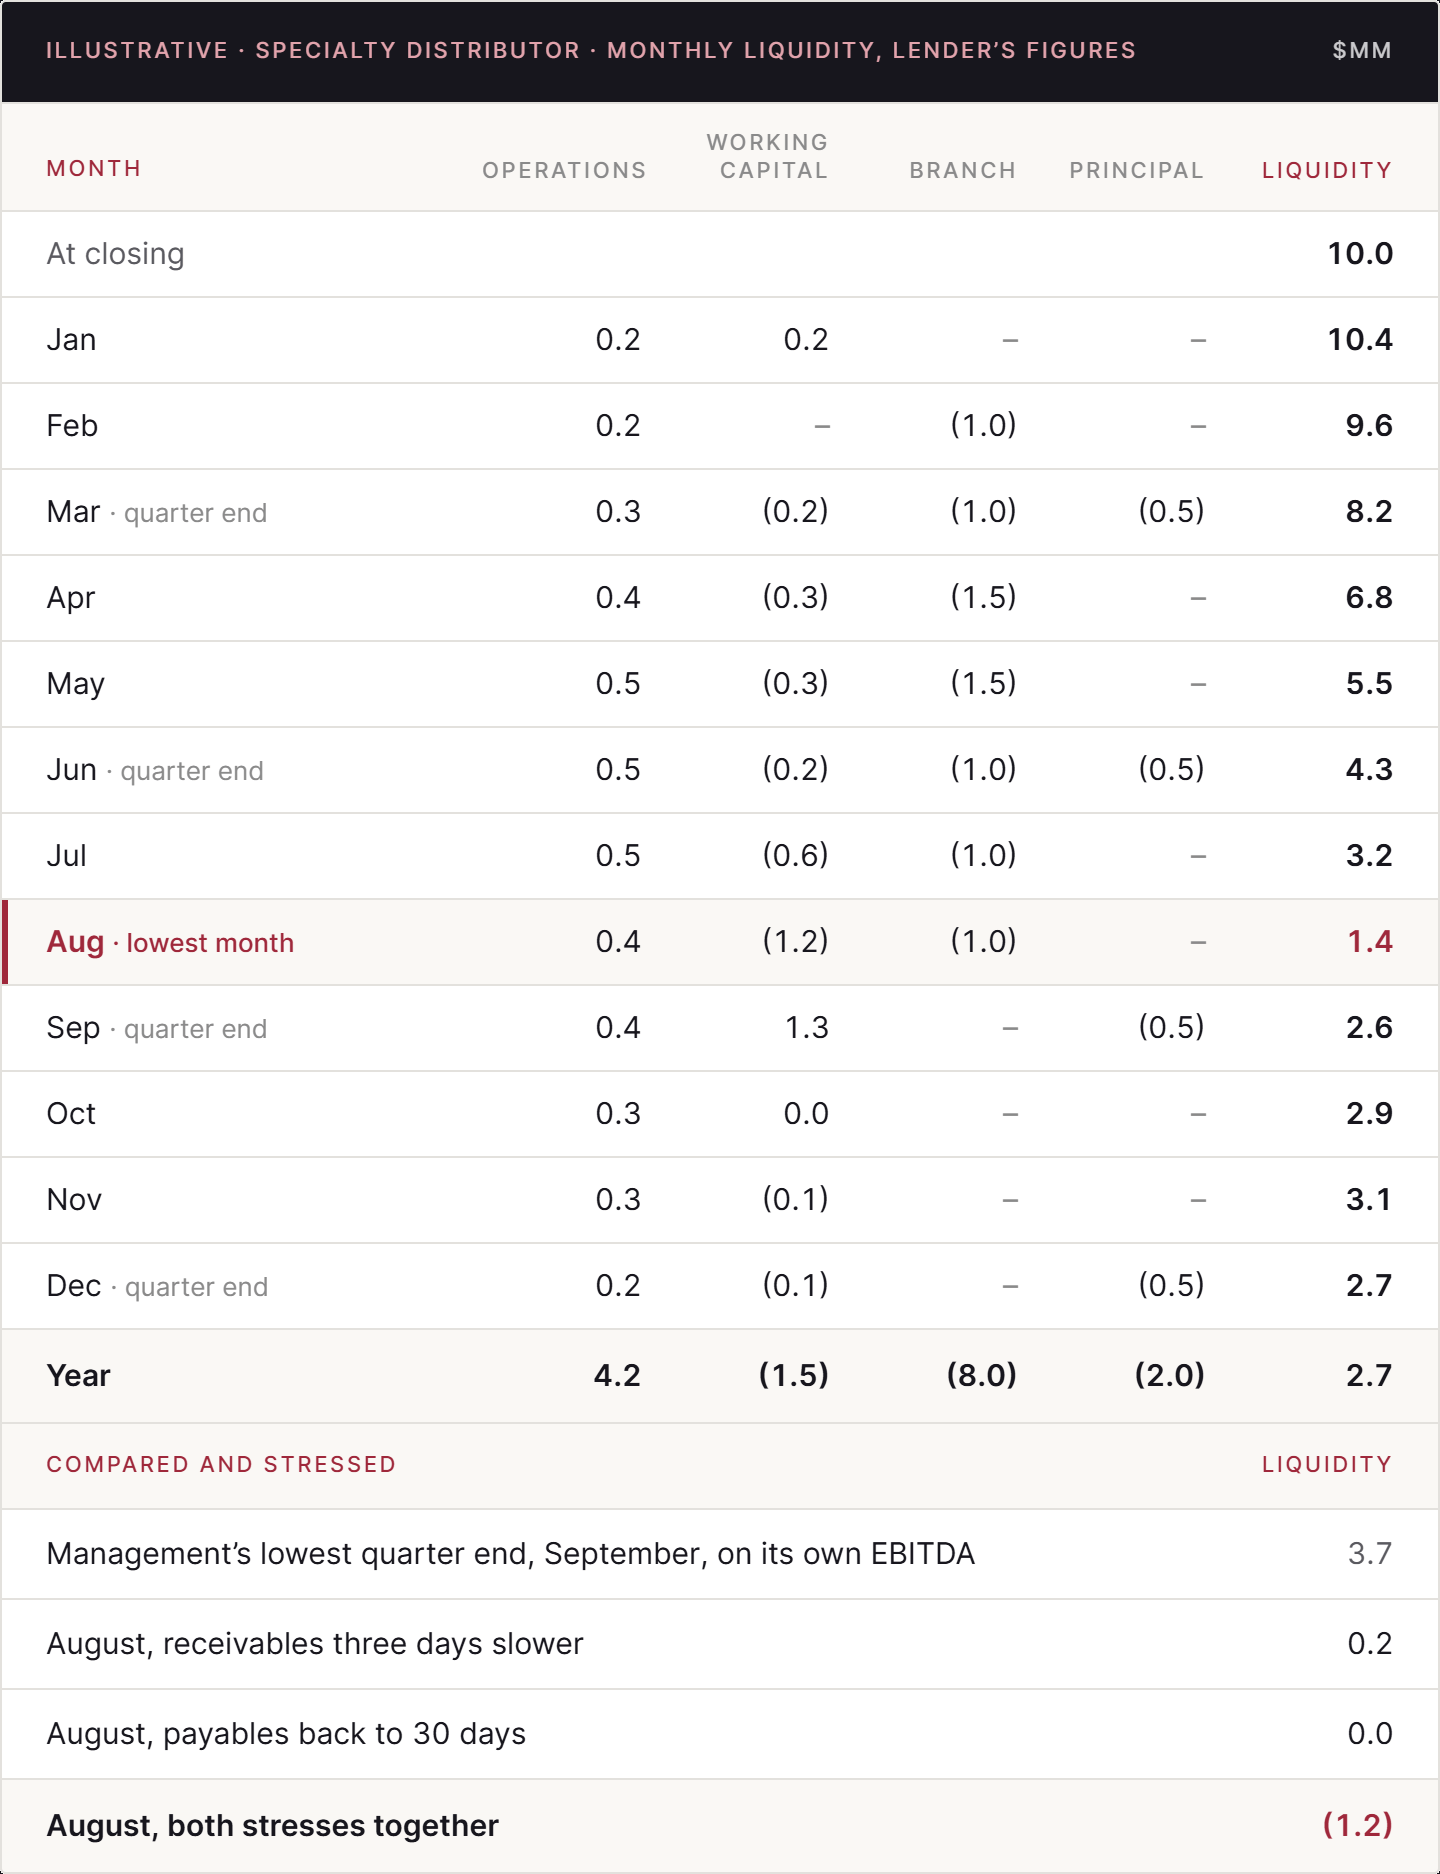
Liquidity falls to $1.4mm in August. The branch is complete by then, and receivables and inventory are at their seasonal high. Most of the peak-season receivables are collected in September, which takes liquidity back to $2.6mm at the quarter end. Management presents liquidity at each quarter end on its own EBITDA figure, and the lowest figure it shows is $3.7mm, at September. The lender’s August figure is $2.3mm lower. About $1.1mm of that comes from the lower EBITDA and $1.2mm from measuring monthly instead of at quarter end.
The lender then applies the two stresses from the working capital schedule to the August figure. Receivables slowing by another three days, as they did over the last two years, ties up about $1.2mm and leaves $0.2mm. Suppliers returning to 30-day terms takes out about $1.4mm and leaves nothing. Together they take August liquidity to $1.2mm below zero, so the facility as proposed leaves almost no room for either stress and does not cover both at once.
For a borrower that is consuming cash
For a borrower that is consuming cash, liquidity is the main measure. A lender calculates runway, the number of months that cash and committed facilities last at the current burn rate, and compares it with the date of the next funding milestone, such as a product launch or the next equity round. A borrower burning $1.5mm a month with $30.0mm of liquidity has 20 months of runway. A lender also tracks the burn trend, whether monthly burn is rising or falling. Working capital still counts, because receivables and inventory for a growing product use cash on top of operating losses. The usual covenant is a minimum cash covenant, which requires the borrower to hold a set amount of cash at all times. The lesson on the cash-consuming borrower covers this case in full.
What the liquidity read produces
At the end of this component a lender has the cash conversion cycle and its trend, working capital as a percentage of revenue applied to the growth plan, available liquidity net of restrictions, sources and uses over the next 12 to 24 months in its base and stress cases, and a monthly cash profile with the lowest month identified.
The analysis draws on the customer payment terms and supplier terms reviewed in the model layer. Its output is used in two places. The working capital figure feeds the free cash flow walk behind coverage. The lowest month and the stress cases show how much availability the structure needs after closing.
A borrower can build its own monthly cash profile and working capital trend before a lender asks for them. How a particular lender will treat stretched payables, how much availability it will want above the lowest month, and how it will size a revolver around the seasonal build depend on how it has lent to similar businesses before.
Next in the series
Capital intensity: maintenance spending, growth spending, and what is left
Maintenance and growth capex, and the free cash flow left after the growth plan.
You can build your own monthly cash profile and working capital trend. Knowing how the lenders in your process will treat stretched payables, and how much availability they will want above your lowest month, is the part I do at Synthase Capital Partners.