


Part of The Underwriter’s Read, a series on the critical questions a credit team works through before they lend.
Leverage is total debt divided by EBITDA. A lender rebuilds both parts before accepting the figure a borrower presents. The debt figure often leaves out obligations that will have to be paid, such as an earnout on a prior acquisition or a deferred purchase price. The EBITDA figure depends on which add-backs are accepted, which was the subject of the lesson on cash flow and coverage. A lender then measures leverage twice: as it stands today, and pro forma at closing with the new loan fully drawn.
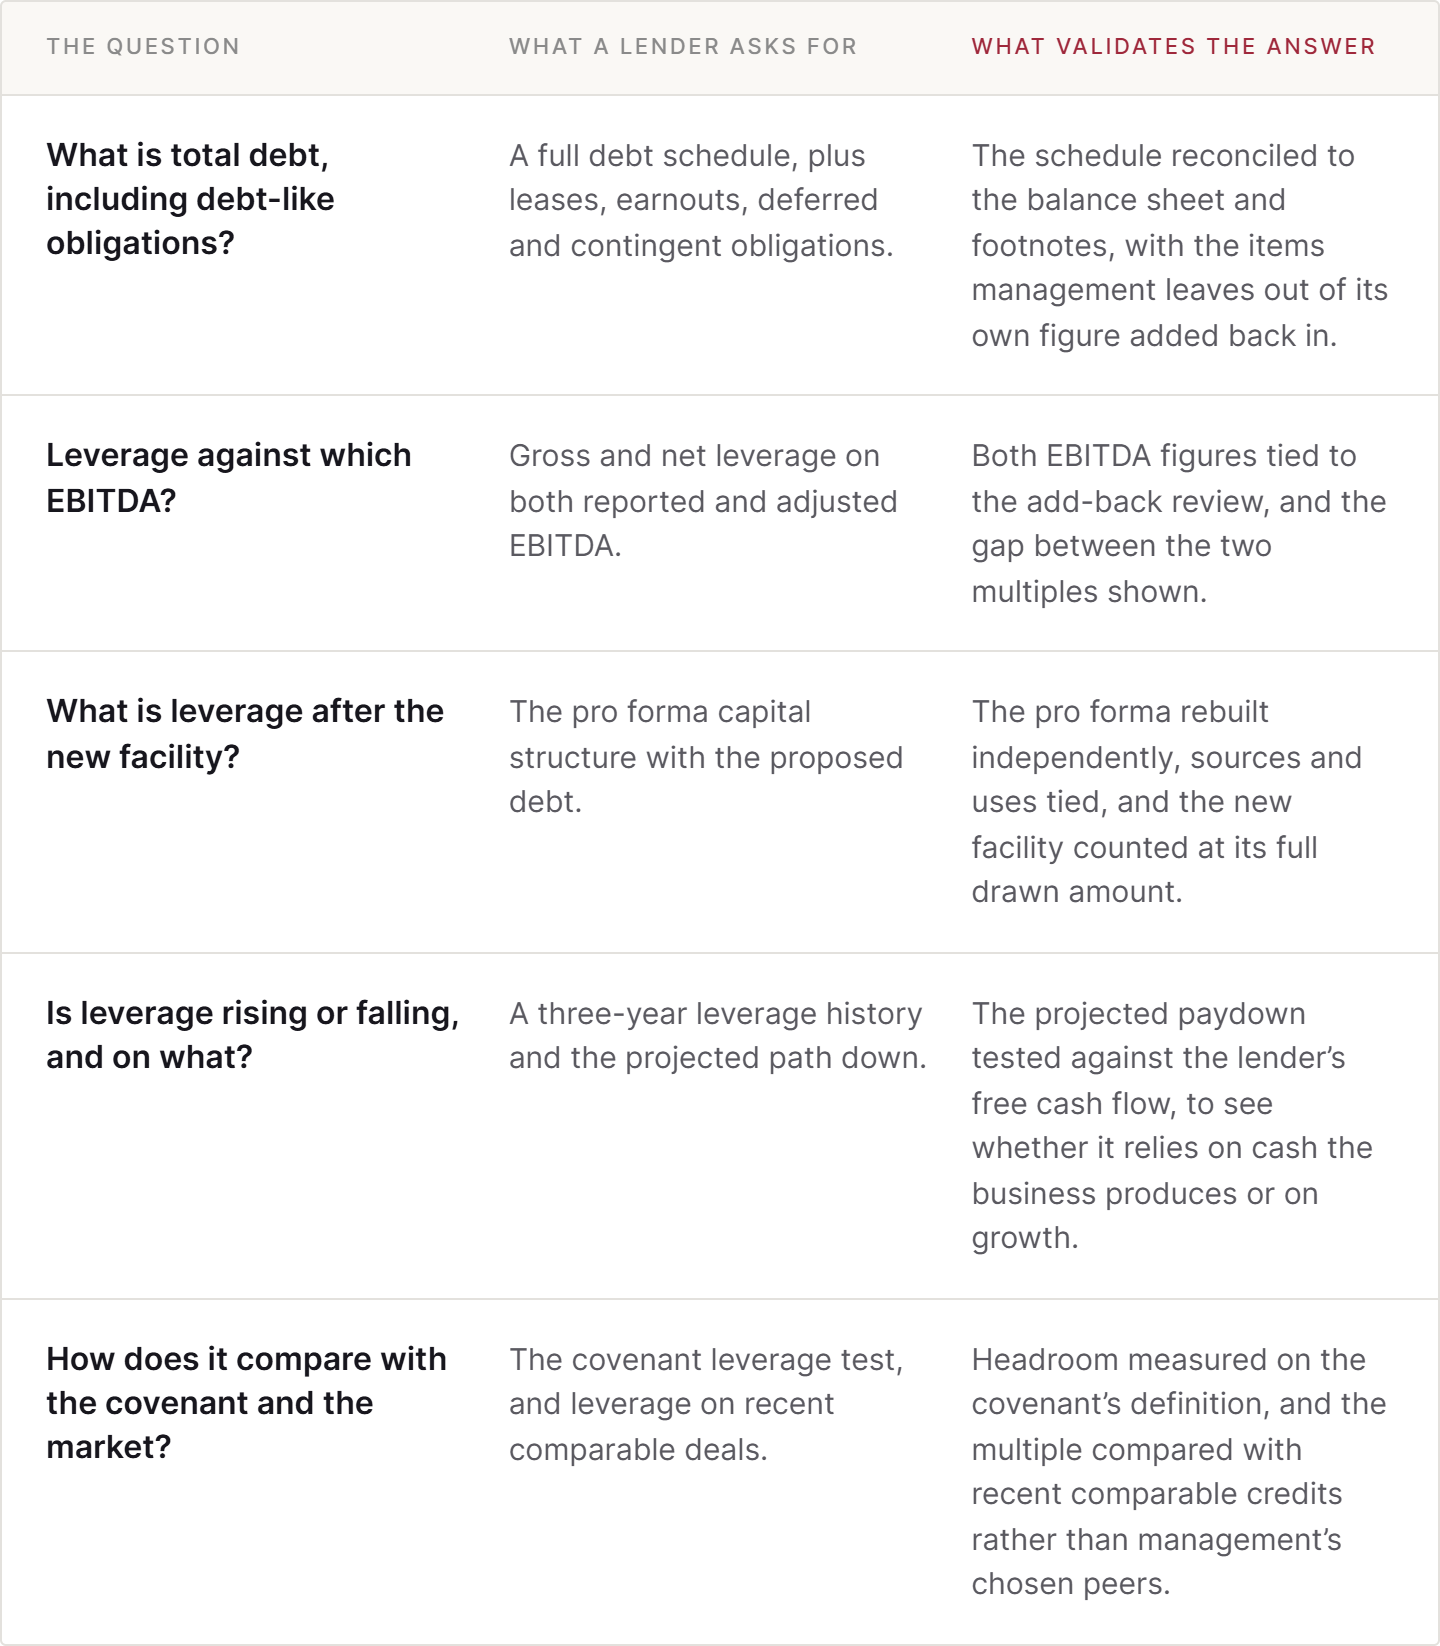
Five probes sit in this component. The first establishes total debt, including debt-like instruments and obligations. The second calculates leverage on both reported and adjusted EBITDA. The third rebuilds leverage pro forma for the new facility. The fourth tests the plan for bringing leverage down. The fifth compares leverage with the covenant and with recent comparable deals.
Management’s projection usually shows leverage falling quickly after closing, as EBITDA grows and free cash flow pays down debt. A lender rebuilds that path from its own EBITDA and its own free cash flow figure, including the obligations management left out. Where the lender’s path falls more slowly, the difference shows how much of management’s deleveraging depends on growth that has not happened yet rather than on cash the business already produces.
The five probes, and what validates the answer
Counting all the debt
The first probe builds a complete debt schedule. It starts with funded debt: the revolver, term loans, and any seller notes from past acquisitions. It then adds obligations that are not called debt but will be paid in cash ahead of or alongside the lender. The common ones are earnouts on prior acquisitions, deferred purchase price, capital leases on equipment and vehicles, unfunded pension obligations, and letters of credit that could be drawn. The situation lesson on existing capital asked for these at the start of the process. This probe puts a figure on each one.
A lender reconciles the schedule to the balance sheet and the notes to the financial statements, because contingent items such as earnouts usually appear only in the notes. Management’s own leverage figure often uses funded debt alone. Operating leases on warehouses and branches are a judgment call: credit agreements often leave them out of the leverage test, while some lenders include them in their own view of the business, adjusting EBITDA for rent when they do.
Which EBITDA
The second probe calculates leverage on more than one EBITDA figure, and on both a gross and a net basis. Gross leverage uses total debt. Net leverage subtracts cash on the balance sheet. The gap between leverage on reported EBITDA and on adjusted EBITDA shows how much of the headline multiple depends on add-backs. A borrower at three times on adjusted EBITDA and more than four times on reported EBITDA is asking a lender to accept the add-backs as recurring earnings. The lender uses the EBITDA figure it arrived at in its own add-back review.
Pro forma at closing
The third probe rebuilds the capital structure as it will stand on the day the loan closes. Current leverage matters less than pro forma leverage, because the new facility is what the lender is being asked to take on. A lender builds sources and uses for the transaction, confirms that the new facility repays what it is meant to repay, and counts the new facility at its full drawn amount. A revolver sized at $10mm but drawn at $4mm at closing is still counted at the amount the borrower can draw, because the borrower will draw it when cash is short.
An illustrative schedule
The schedule below continues the specialty distributor from the previous lesson. The borrower has $27.0mm of funded debt today. A new $33.0mm senior facility repays the existing revolver and term loan of $24.0mm, pays $1.0mm of fees, and funds $8.0mm for a new branch and its inventory. The $3.0mm seller note from a prior acquisition stays in place. Pro forma funded debt is $36.0mm. The same acquisition also carries a $1.5mm earnout and $1.0mm of deferred purchase price, which management leaves out of its leverage figure.
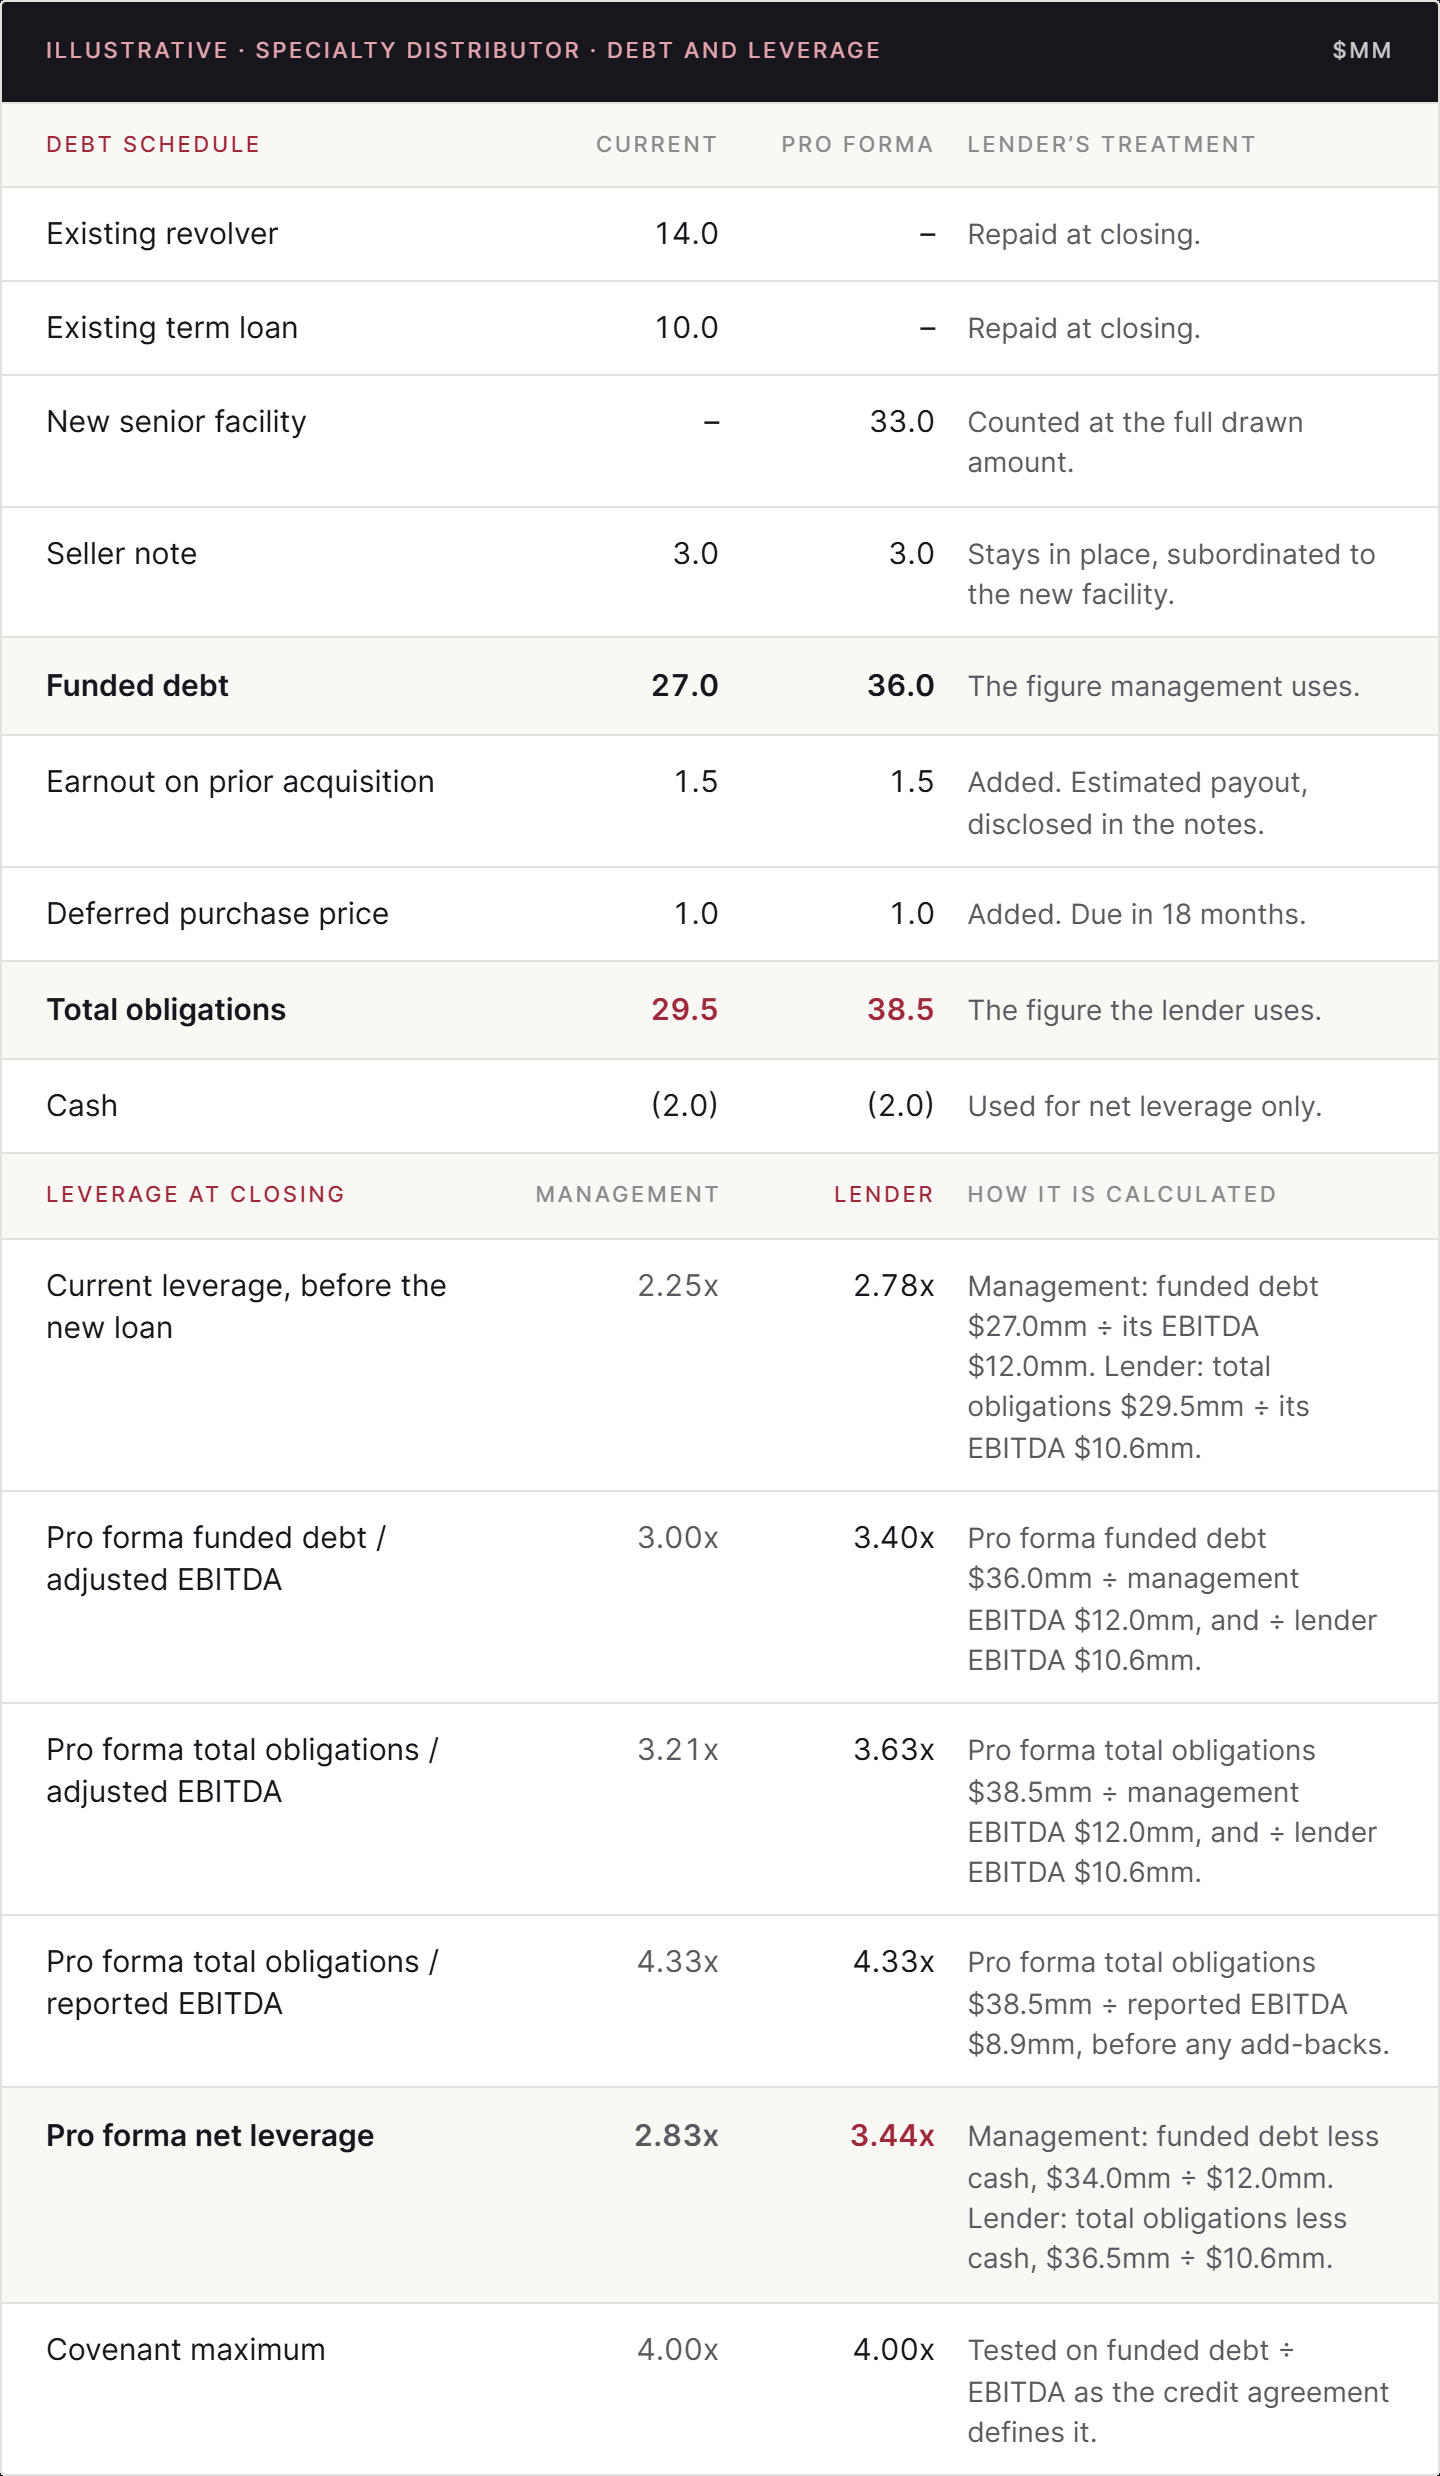
Management presents leverage of 3.0 times at closing. The lender’s figure on the same debt is 3.4 times, and 3.6 times once the earnout and deferred purchase price are included. On reported EBITDA, before any add-backs, it is 4.3 times. The covenant is tested on funded debt, so the lender’s 3.4 times leaves room for EBITDA to fall to $9.0mm, about 15 percent, before the covenant is breached. The coverage covenant in the previous lesson breaches after a fall of about 11 percent, so for this borrower coverage is the tighter of the two tests.
The path down
The fourth probe looks at which way leverage is moving. It uses the three-year history and management’s projected path. Leverage can fall because debt is repaid or because EBITDA grows, and a lender separates the two. Debt repaid from free cash flow the business already produces is the more reliable source. A path that depends on EBITDA growth depends on the growth assumptions the model and durability work tested.
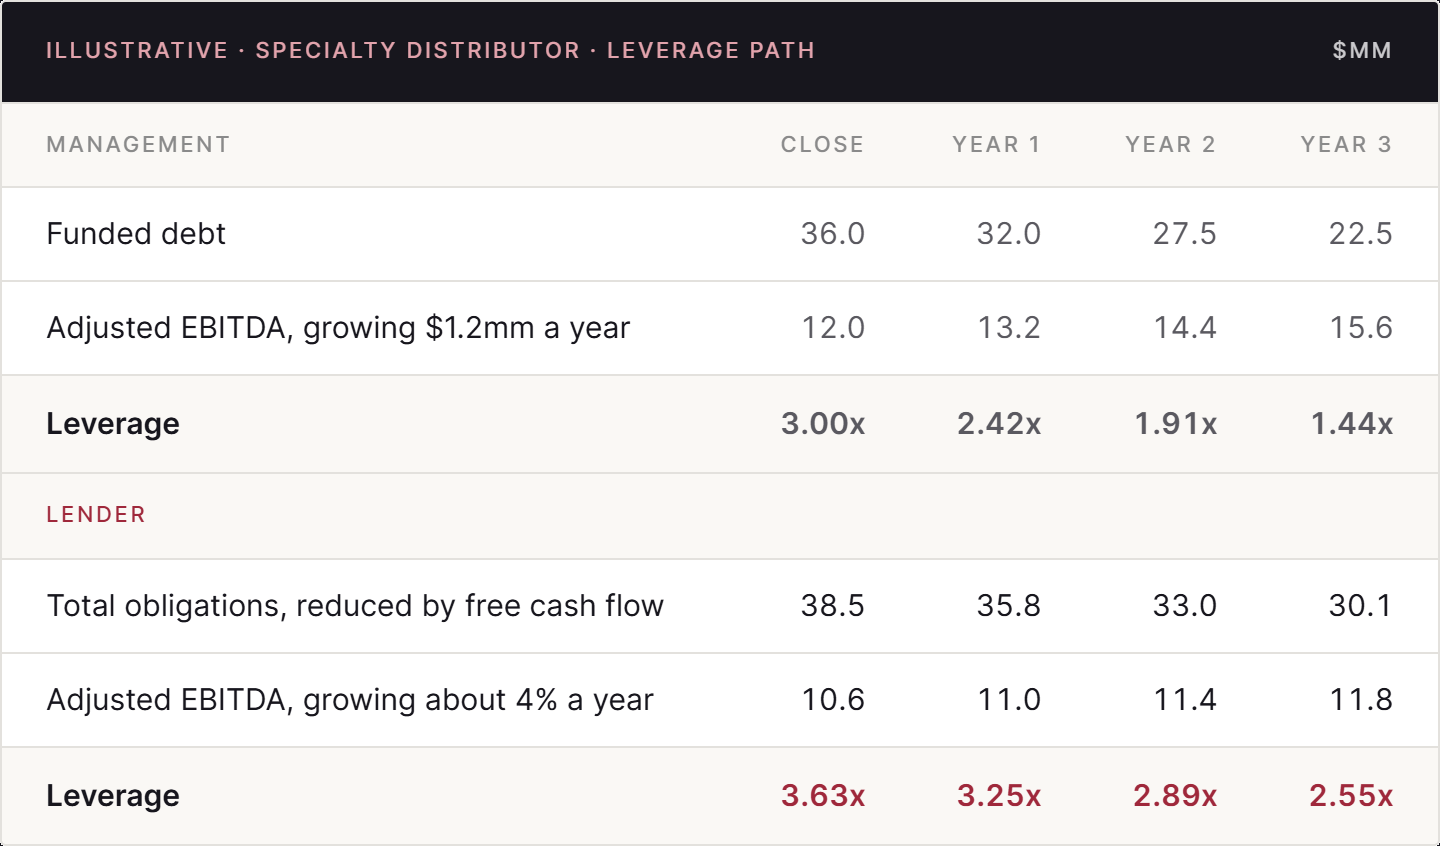
Management’s path reaches 1.4 times in three years. Most of that fall comes from repaying debt, and about a third from EBITDA growing by $1.2mm a year. The lender’s path uses its own EBITDA, grows it at the rate the durability work supports, and repays debt only from the $2.7mm to $2.9mm of free cash flow a year that its own figures produce. It reaches 2.6 times. Both paths are reasonable starting points for a discussion, and the gap between them shows how much of management’s case rests on growth.
Against the covenant and the market
The fifth probe measures headroom against the leverage covenant, using the covenant’s own definitions of debt and EBITDA. Those definitions set which obligations count and which add-backs are allowed, in the same way as for the coverage test. A lender also runs its downside case through the leverage test. For the distributor, the downside from the previous lesson takes EBITDA to $9.7mm, which puts funded leverage at 3.7 times against the 4.0 times covenant.
A lender then compares the borrower’s leverage with recent comparable deals: credits of a similar size, in a similar industry, closed in the current market. Management sometimes presents a peer group chosen to make its multiple look moderate. A lender uses its own record and what it sees in the market, and a multiple above the range for comparable credits needs a specific reason, such as contracted revenue or strong collateral.
For a borrower that is consuming cash
A leverage multiple has no meaning when EBITDA is negative. A lender sizes the loan against the value of the company instead, using loan-to-value: the loan divided by enterprise value or by the valuation at the last equity round. A $15mm loan to a company valued at $150mm at its last round is a 10 percent loan-to-value. The debt schedule still matters, because earnouts, deferred payments and other obligations rank alongside or ahead of the lender, and the pro forma still counts the new facility at its full drawn amount. The deleveraging path is replaced by the plan to reach breakeven, and the leverage covenant by a minimum cash covenant. The lesson on the cash-consuming borrower covers this case in full.
What the leverage read produces
At the end of this component a lender has a complete debt schedule including debt-like obligations, leverage on reported and adjusted EBITDA on a gross and net basis, current and pro forma leverage at closing, its own projected path for bringing leverage down, and headroom against the covenant in its base and downside cases.
That output is used in three places. The pro forma leverage sets the loan amount the lender is prepared to commit. The debt schedule shows where the new loan ranks against the other obligations, which the repayment layer covers. And the lender’s projected path sets expected leverage at maturity, which is what a refinancing lender will look at.
A borrower can build its own full debt schedule and pro forma leverage before a lender asks for them. Which obligations a particular lender will count, where it will set the covenant, and how much of the growth in management’s path it will accept depend on what they have lent against before.
Next in the series
Liquidity and working capital: how much cash growth ties up
Receivables, inventory and supplier terms, and the lowest point in the cash balance over the next 12 to 24 months.
You can build your own debt schedule and pro forma leverage. Knowing which obligations the lenders in your process will count, and where they will set the covenant, is the part I do at Synthase Capital Partners.