


Part of The Underwriter’s Read, a series on the critical questions a credit team works through before they lend.
The revenue work separated the base that is contracted from the base that has to be re-won, and the customer concentration work named the accounts that carry it. This block establishes what holds those accounts in place when a contract comes up for renewal. A lender is looking for a mechanism that is built into the product or the contract, because that is the version of retention that survives a period when the customer is cutting spend.
Four probes sit in this block, and they group together as a claim and its verification. The first asks the borrower to name the mechanism that creates retention. The second checks that claim against what the existing base actually bought again. The third establishes whether the base grows on its own or has to be refilled with new accounts to stand still. The fourth establishes how much of the retention rests on the product and how much rests on a person.
These probes let a lender rebuild the revenue forecast from the existing base rather than from a growth rate. Gross retention establishes what last year’s customers bought again with no new selling at all, which sets the floor the forecast is built on top of. Net retention adds the growth that came from inside that base, whether that is more volume, another site, or another product line, and revenue from customers already buying is treated differently from revenue that requires winning new customers each year to hit the plan. Splitting the forecast into those two pieces produces a view on capacity to service debt that holds even if new business slows, instead of accepting a single blended growth assumption.
Three things that can hold a customer
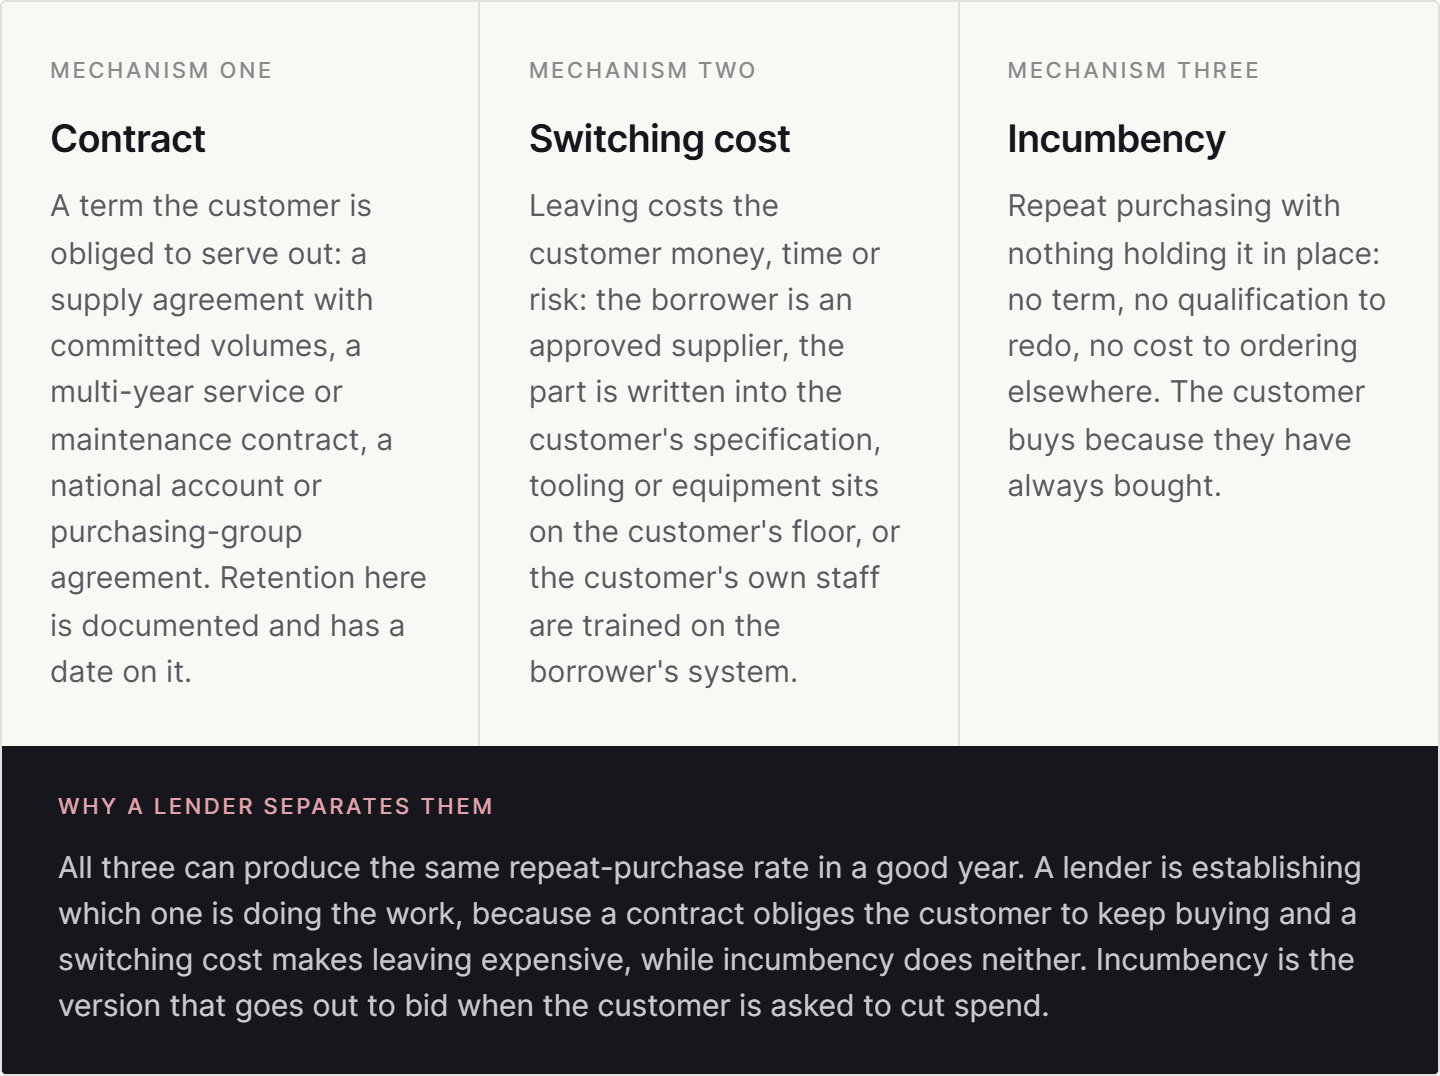
Borrowers usually describe retention as a relationship quality: customers are happy, the team is responsive, the account has bought from them for twenty years. A lender is looking for the structural version of the same fact. There are three common mechanisms, and they behave differently when the customer is under pressure or the purchasing department goes out to bid.
The four probes, and what validates the answer
The first probe collects a claim and the other three test it. Two of the requests reuse work already done: the customer-by-customer revenue history comes from the revenue analysis, and the key-account list comes from the customer concentration work.
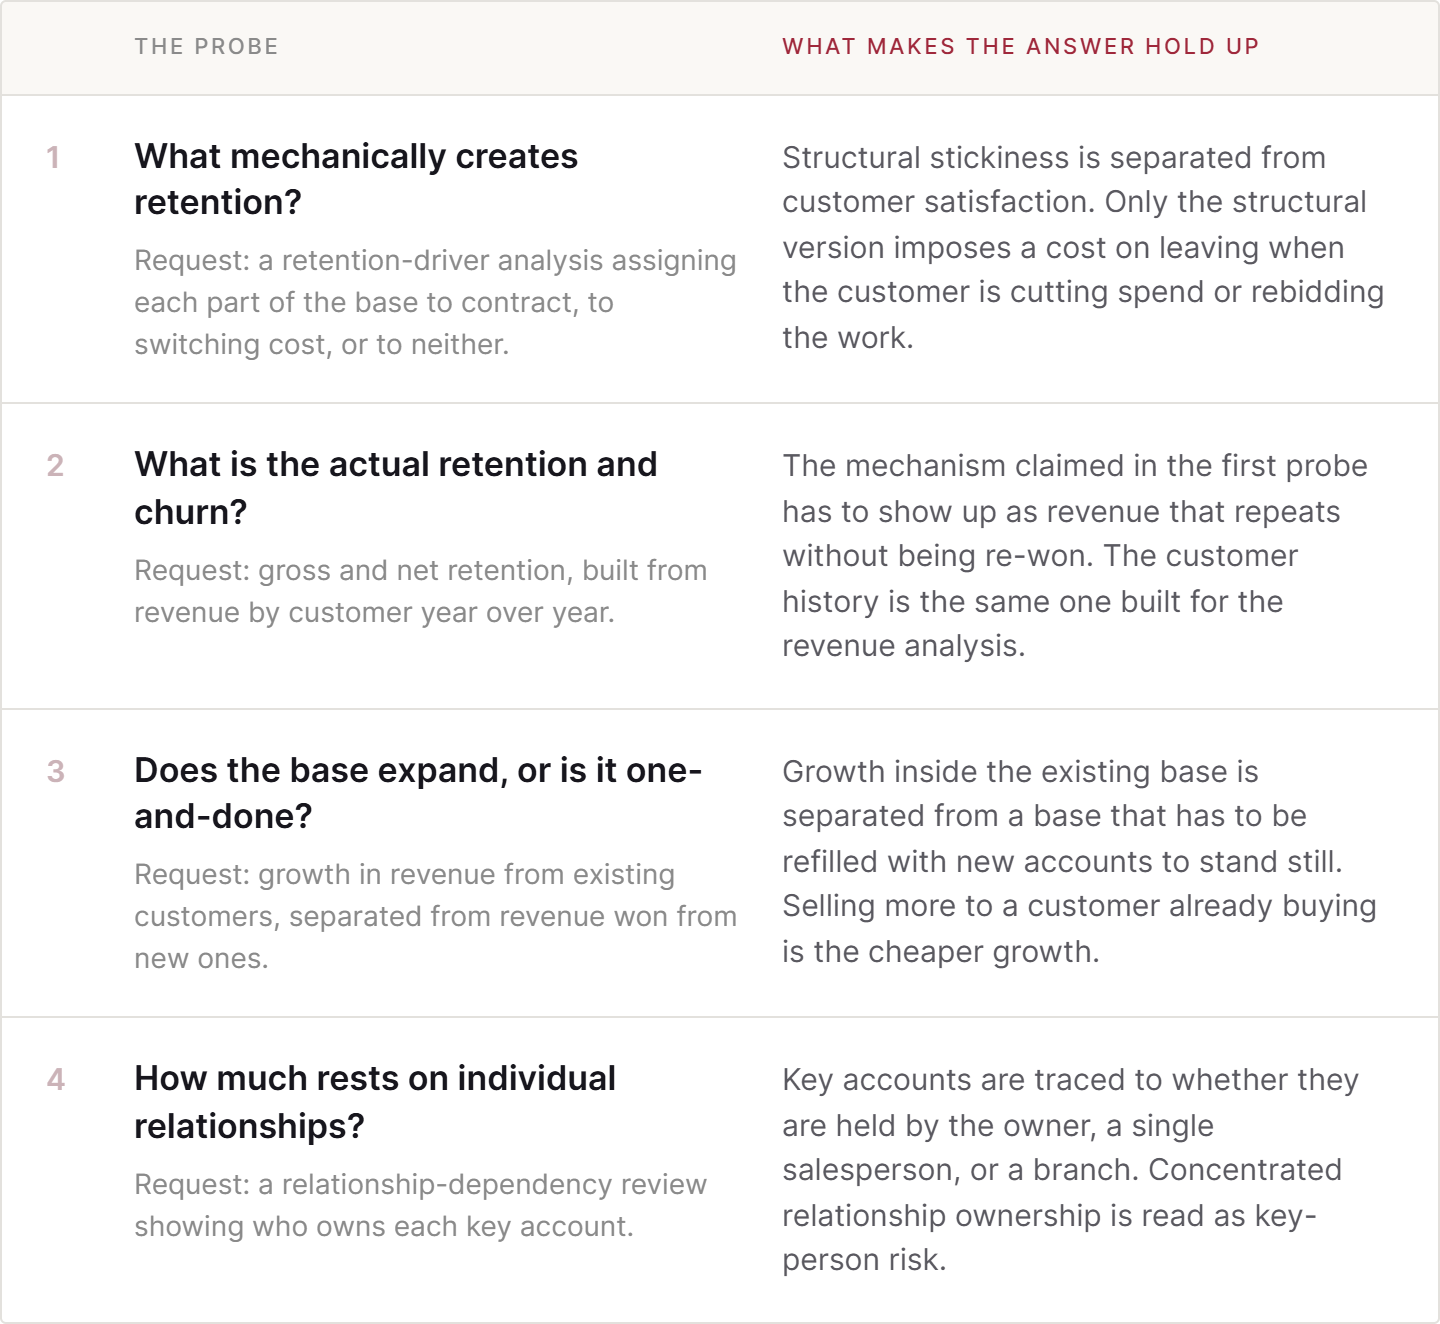
The first probe is the one borrowers answer least precisely, and the request is specific for that reason. Naming the mechanism means assigning each part of the base to contract, to switching cost, or to neither, and the shares matter more than the label. A business that describes its customers as locked in and finds that two thirds of revenue sits in the third category has answered the question.
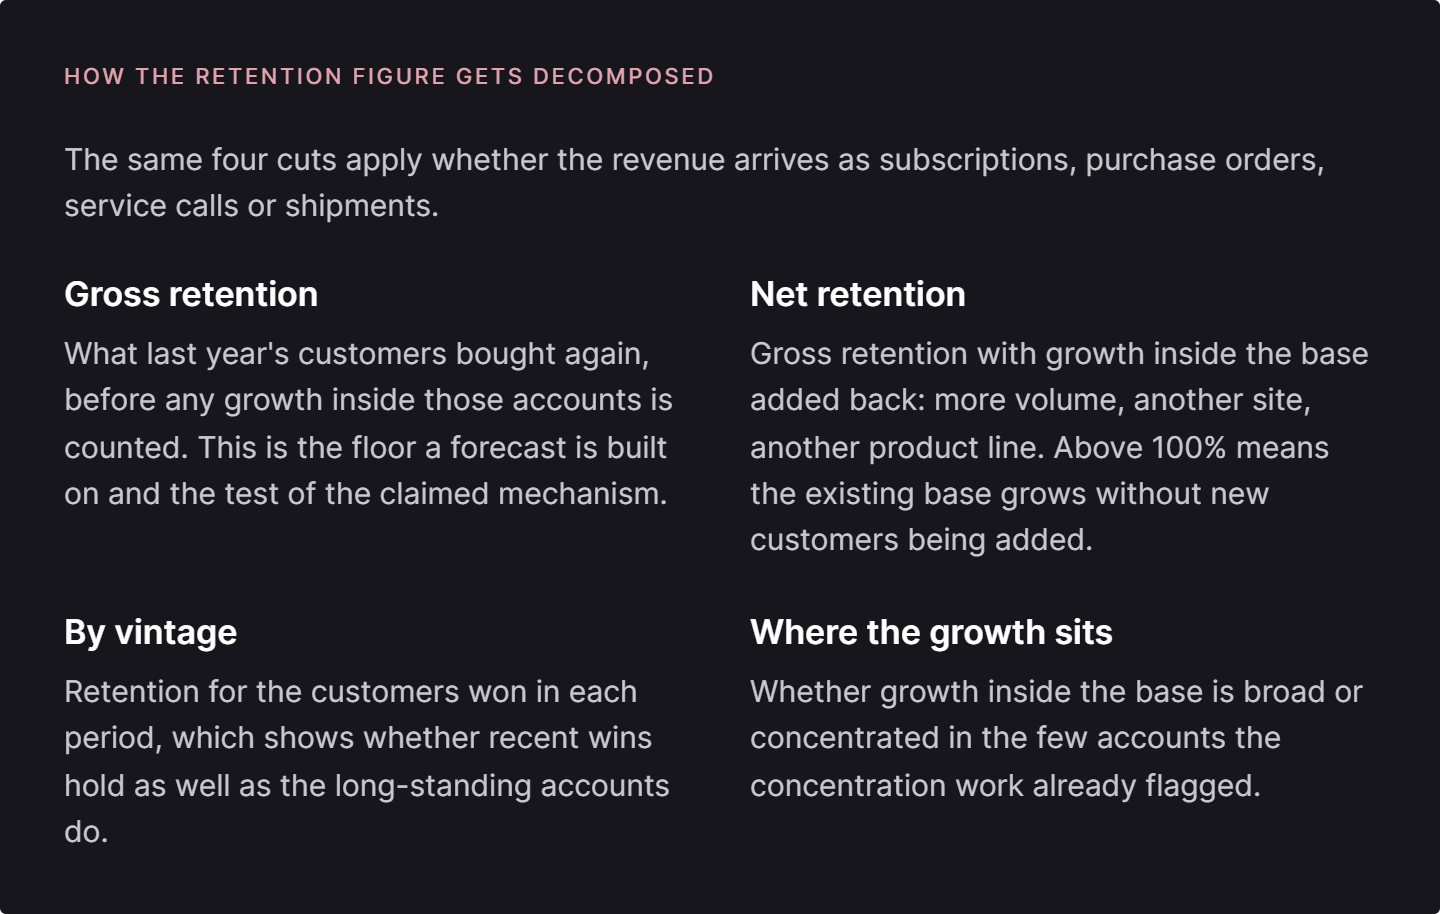
The second probe settles the first one with data. Gross retention measures how much of last year’s revenue the same customers bought again, before any growth inside those accounts is counted, so it is the number that tests whether the claimed mechanism exists. Net retention adds that growth back in and can sit comfortably above 100% while gross retention is poor, which describes a business where a few expanding accounts are covering for a base that is leaving.
What the repeat-revenue data is read for
Retention presented as a single company-wide percentage tells a lender very little. The same figure gets decomposed, and each cut answers a different question about the forecast.
The third probe reads the direction in that data. A base that expands on its own generates growth at low acquisition cost, and one that is one-and-done requires the selling effort to continue at its current level for the revenue line to stay flat, whether that effort is a sales force, distributor incentives, or bidding on new work. That distinction sets what a lender expects to happen to cash flow if the borrower cuts that spend to protect coverage.
The fourth probe steps outside the data and into who owns the account. Where the largest customers were won by the owner and are still managed by the owner, or sit with one salesperson who carries the contacts, retention and key-person exposure are the same exposure. A lender maps key-account ownership for that reason, and the finding carries into the management and execution work rather than staying inside the customer analysis.
What the relationship read produces
At the end of this block a lender has the retention floor and the mechanism behind it: how much of the base repeats without any new selling, what holds it there, and how much of the projected growth comes from customers already buying. That is the piece of the forecast a lender can underwrite without taking a view on new business.
It feeds two later pieces of the analysis. The mechanism goes to the work on customer pricing power, where a lender tests whether the lock-in is real enough to hold price in a negotiation. The key-account ownership map goes to the work on management and execution risk. The customer revenue history itself is shared with the revenue analysis, which is where the contracted and re-won split was built.
A borrower can produce the year-over-year revenue history by customer and assign each part of the base to a retention mechanism from their own billing records. What gross retention level a particular lender treats as evidence of durable stickiness, how much weight they put on an approval or a specification they cannot verify, and whether owner-held key accounts change the structure they will offer depends on their own experience of businesses that looked the same.
Next in the series
Cost structure: how much of the cost base is fixed
Which costs stay when revenue falls, how quickly the rest can come down, and where coverage sits if they cannot.
You can build the year-over-year revenue history by customer and name the mechanism behind your own base. Reading how a particular lender weighs that mechanism, and whether owner-held accounts change the structure they will offer, is the part I do at Synthase Capital Partners.