


Part of The Underwriter’s Read, a series on the critical questions a credit team works through before they lend.
This is the first of the nine model questions, and it comes first because revenue composition drives much of the underwriting thesis. Growth matters, and so does what sits underneath it. Who is the borrower selling to, and on what terms. How much of the revenue is committed by a counterparty and for how long. Whether it repeats, and whether it moves with a cycle. How concentrated it is by account, by product or service type, and by geography. Each of those changes what a lender expects the revenue to do over the term of a loan, and the answers determine how much debt the same topline will support.
Composition is also what lets a lender assess the projections. Every borrower presents a forecast, and a lender has no basis to accept or discount it without knowing how the current revenue is built. A forecast that grows a contracted base with three years of remaining term is a different proposition from one that grows a base re-won every quarter, even at the same growth rate. Understanding the model is what allows a lender to form a view on the borrower’s capacity to generate cash flow to service the debt over the life of the facility, rather than taking management’s version of that capacity as given.
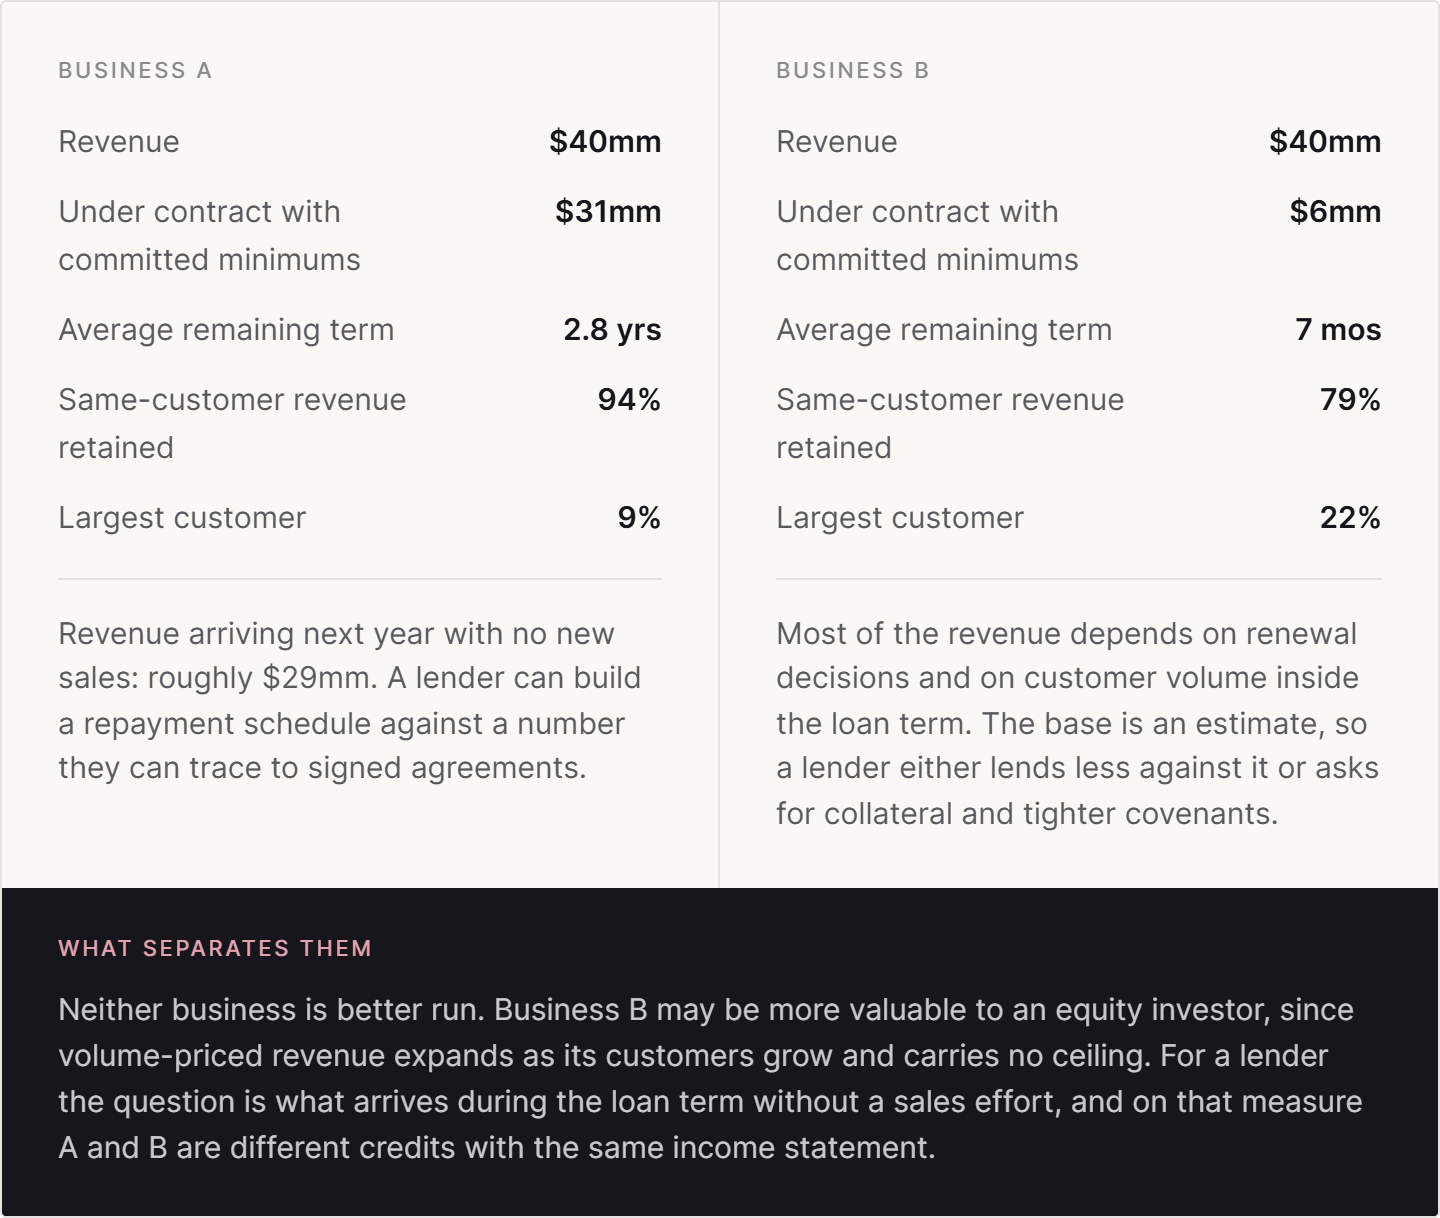
The income statement does not answer that. A single revenue line of $40mm is compatible with a business whose customers are contracted three years out and with a business that re-wins nearly all of its revenue every quarter. Both report the same number. The work in this block is to decompose that number into its parts and establish which parts a lender can rely on.
Four kinds of revenue, counted differently
The first request in this block is revenue disaggregated by type and by stream, trailing twenty-four months, reconciled to total revenue and to the revenue recognition policy. What comes back usually sorts into four categories, and a credit team treats each one differently when sizing a facility.
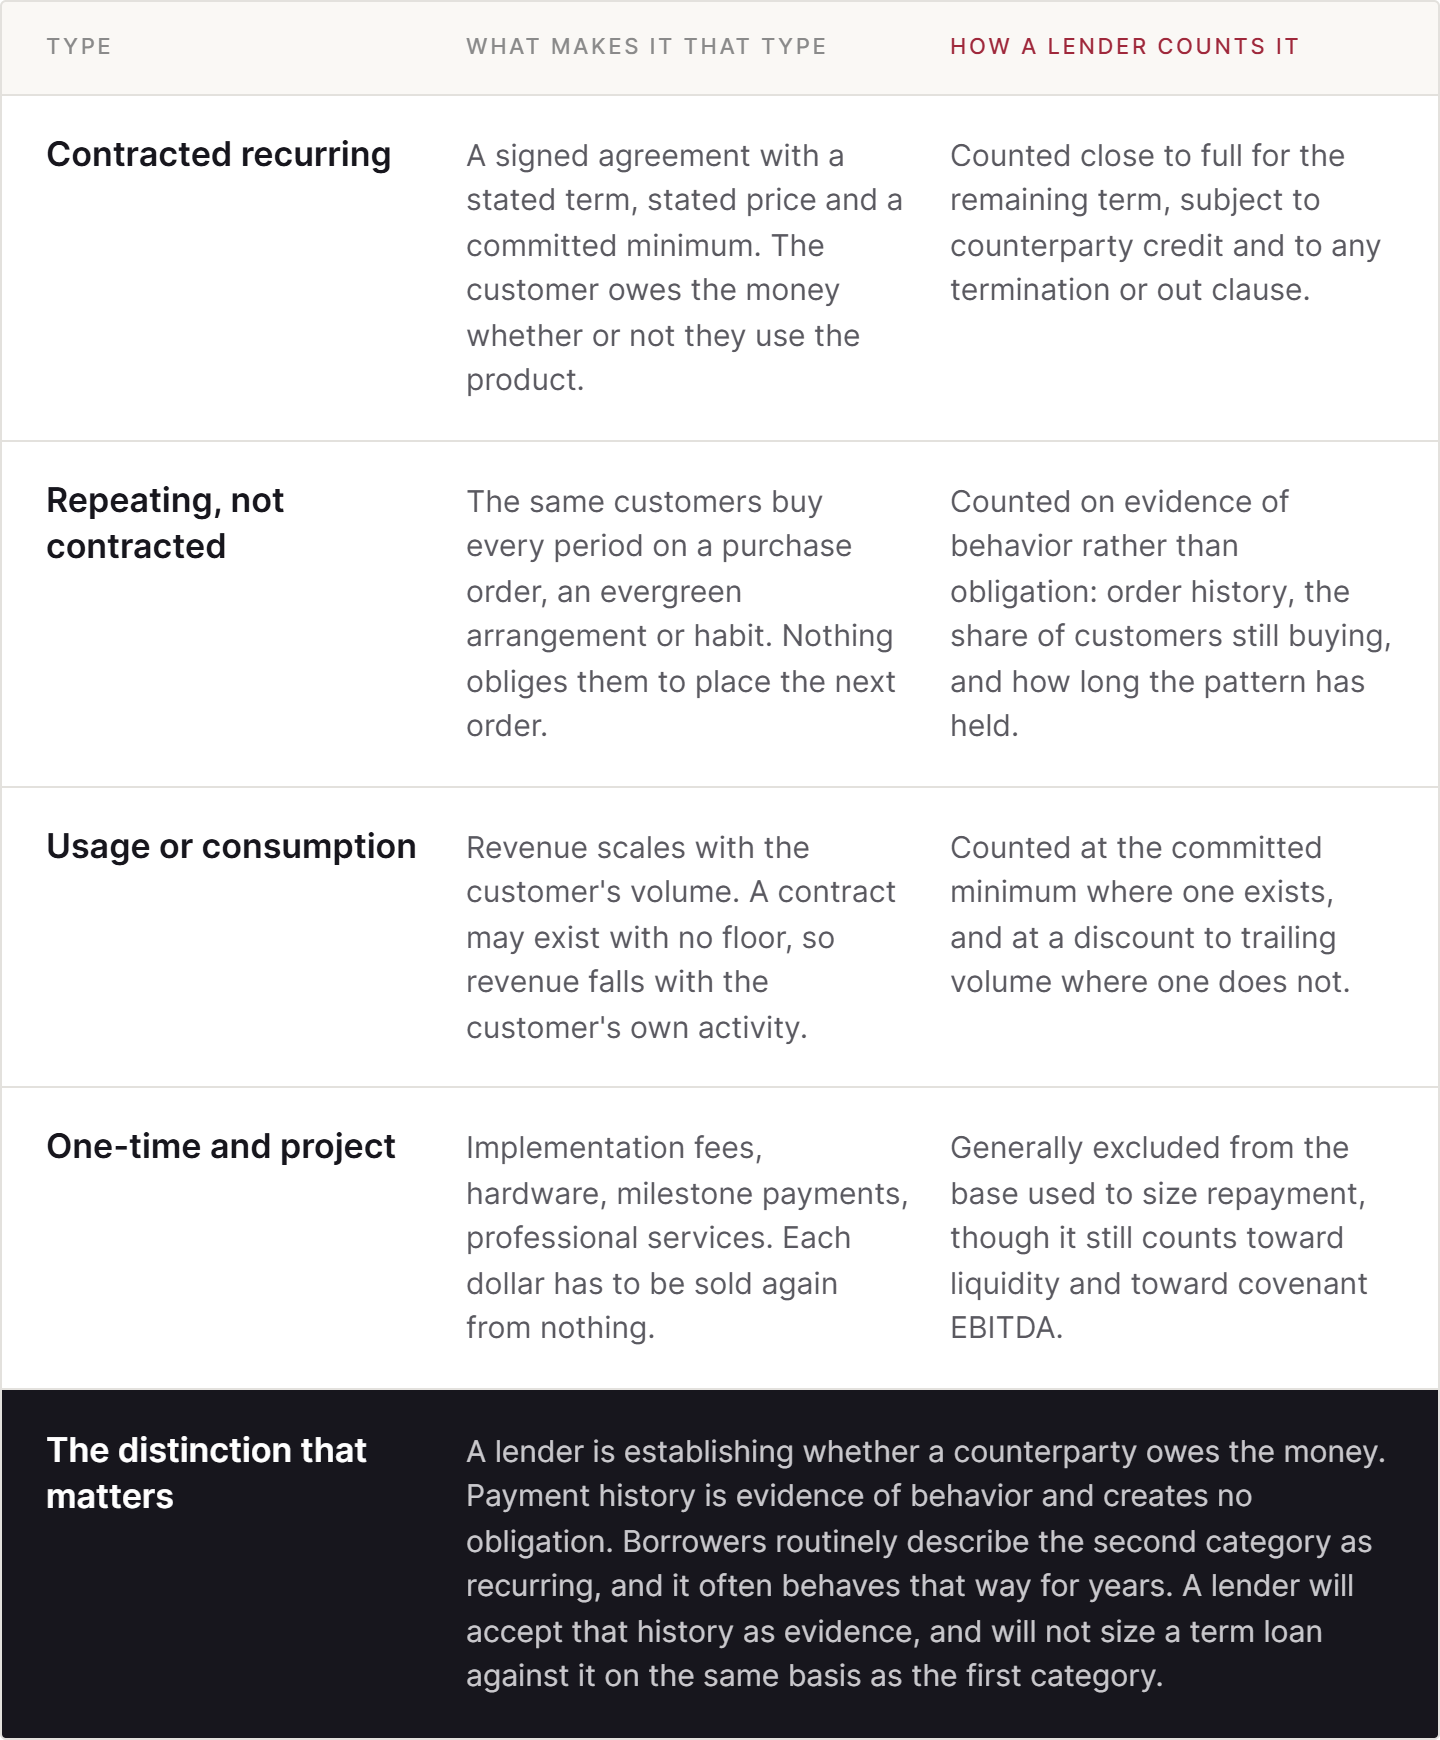
What sits in the first category depends on the business. A distributor holds blanket purchase orders with committed volumes. A healthcare services company holds payer contracts and capitated arrangements. An industrial supplier holds take-or-pay supply agreements. A facilities or equipment business holds multi-year service agreements attached to an installed base. A staffing firm holds master service agreements that commit a client to rates but not to hours, which puts most of its revenue in the second or third category. The question is identical across all of them, and the document that answers it differs.
This is where a borrower’s own reporting most often works against them. Internal dashboards are built to show the topline growing and the recurring share improving, so subscription, committed usage and repeat purchase orders get consolidated into one recurring number. A lender will ask for the same figure rebuilt from contracts, and the two versions rarely match. It is better to reconcile them before a lender does.
Same topline, different credit
Two businesses, both reporting $40mm of revenue and both growing at 18%. Everything a lender does in this block is aimed at telling them apart.
The five probes, and what validates the answer
Each of the nine model blocks resolves into a small number of probes. A probe is a question paired with the specific document that settles it, because an answer given verbally in a management meeting does not survive credit committee. These are the five for revenue streams, in the order a credit team works them.
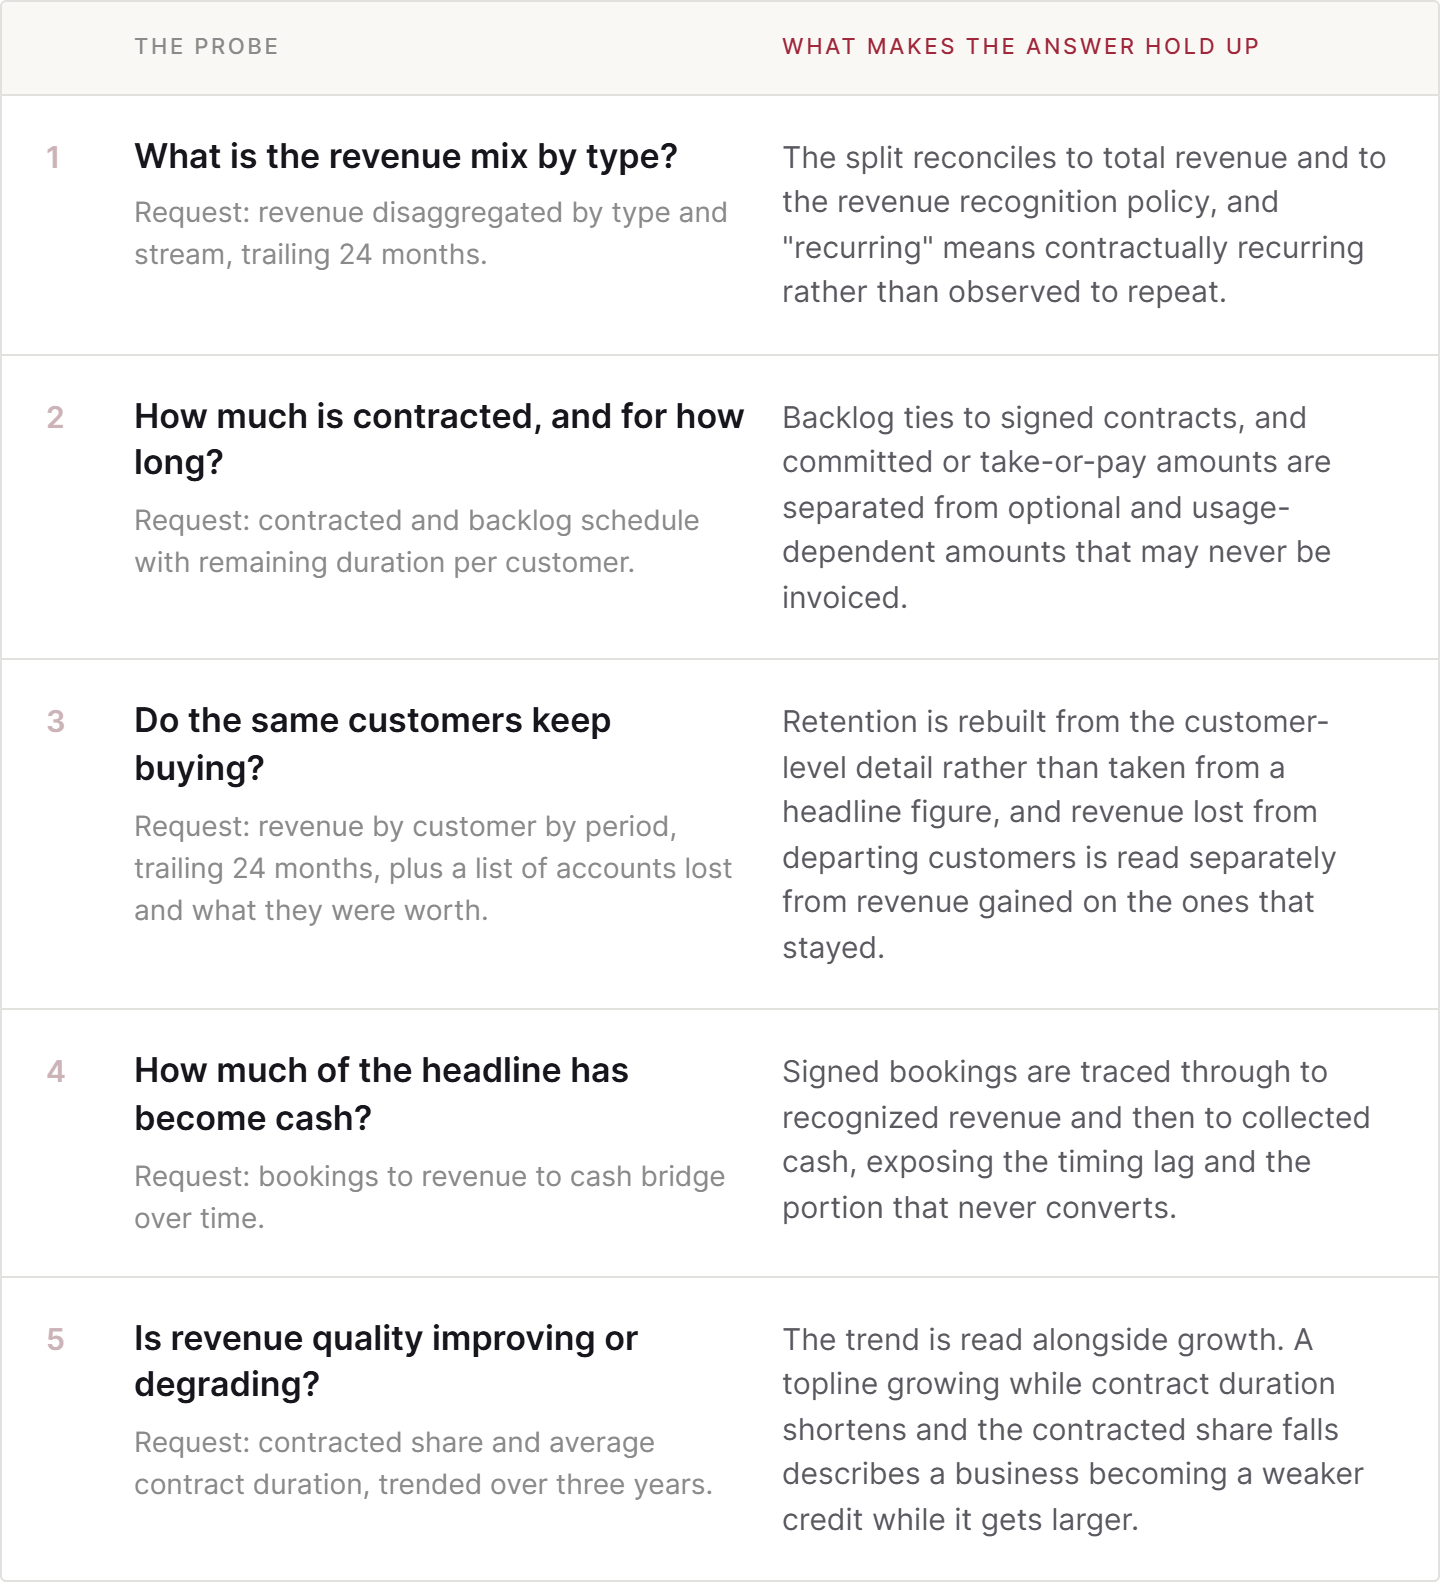
Probe three is where a growth figure most often gets separated into two different things. Total revenue can rise while the same-customer base shrinks, with the growth coming from a smaller number of accounts buying more, or from new accounts replacing departed ones. Both show up as growth. A lender wants the two effects reported separately, because revenue from customers who have already left does not come back and revenue growth from expansion depends on a sales effort continuing to work. A software business measures this as gross and net retention, a distributor as same-customer reorder volume, a services firm as retainer and contract renewals, a manufacturer as repeat order rate by account. The mechanic is the same in each case.
Probe four separates what has been sold from what has been collected. A business can book $12mm of new orders in a year, recognize $7mm as revenue, and collect $5mm in cash, with the balance sitting in deferred revenue, in work in progress, or in receivables aging past ninety days. All three numbers are accurate, and only the third one services debt. This gap is widest in project and milestone-based businesses, where a signed order can be a year from cash. Where the spread between orders and collections has been widening, a credit team treats it as a working capital question and asks for the aged receivable detail before anything else in the block.
Where the contract itself does the work
A borrower with a large contracted base should expect the contracts to be read rather than counted. Four provisions determine how much of a stated contract value a lender will credit.
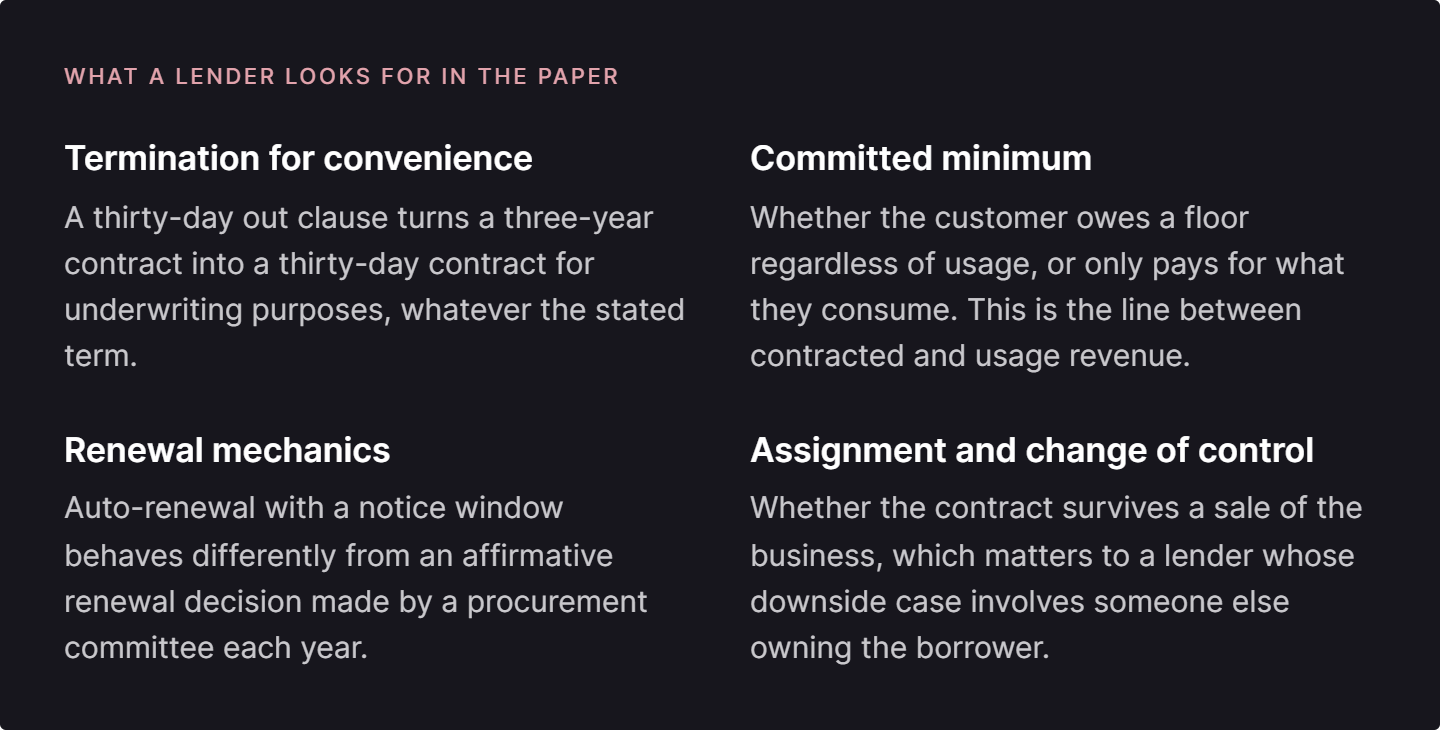
Counterparty credit sits alongside the provisions. A contracted base is only as good as the customers standing behind it, so a lender will look at who those customers are and whether any of them is itself under pressure. Contracted revenue from investment-grade counterparties and contracted revenue from venture-funded counterparties with eighteen months of cash are counted differently, and the second case is common in businesses selling into the technology and life science sectors.
What the decomposition produces
At the end of this block a lender holds a figure that does not appear in the financial statements: the revenue they believe arrives during the loan term without a sales effort. It is smaller than reported revenue in every business. How much smaller, and how much of the gap a particular lender is willing to close on the strength of trailing behavior rather than contract, varies by lender and by market.
That figure carries into the rest of the analysis. It is the base the coverage and leverage tests get run against, it sets how much of the facility a lender will advance on cash flow versus against assets, and it shapes which covenants they propose. A borrower who has not built the figure themselves is in a negotiation about a number they have not seen.
Building it is arithmetic on documents a borrower already has. Understanding where a specific lender will land relative to their own version of it, and whether the difference is worth arguing about or worth structuring around, is a different exercise and it depends on facts that are not in the borrower’s data room: how that lender has treated comparable revenue recently, what the market is pricing, and how much time the borrower has before the date the money has to be in place.
Next in the series
Value propositions: why customers pay, and whether they still would under pressure
What evidence establishes that a product is mission-critical rather than a line item a customer can trim.
You can run the decomposition on your own revenue. Reading how a particular lender will treat what it produces, and what to do about the gap, is the part I do at Synthase Capital Partners.